Posts
Welcome to the USAFacts Data Visualization Blog!
Welcome to our final project blog for EDLD 652 at University of Oregon, Winter 2022
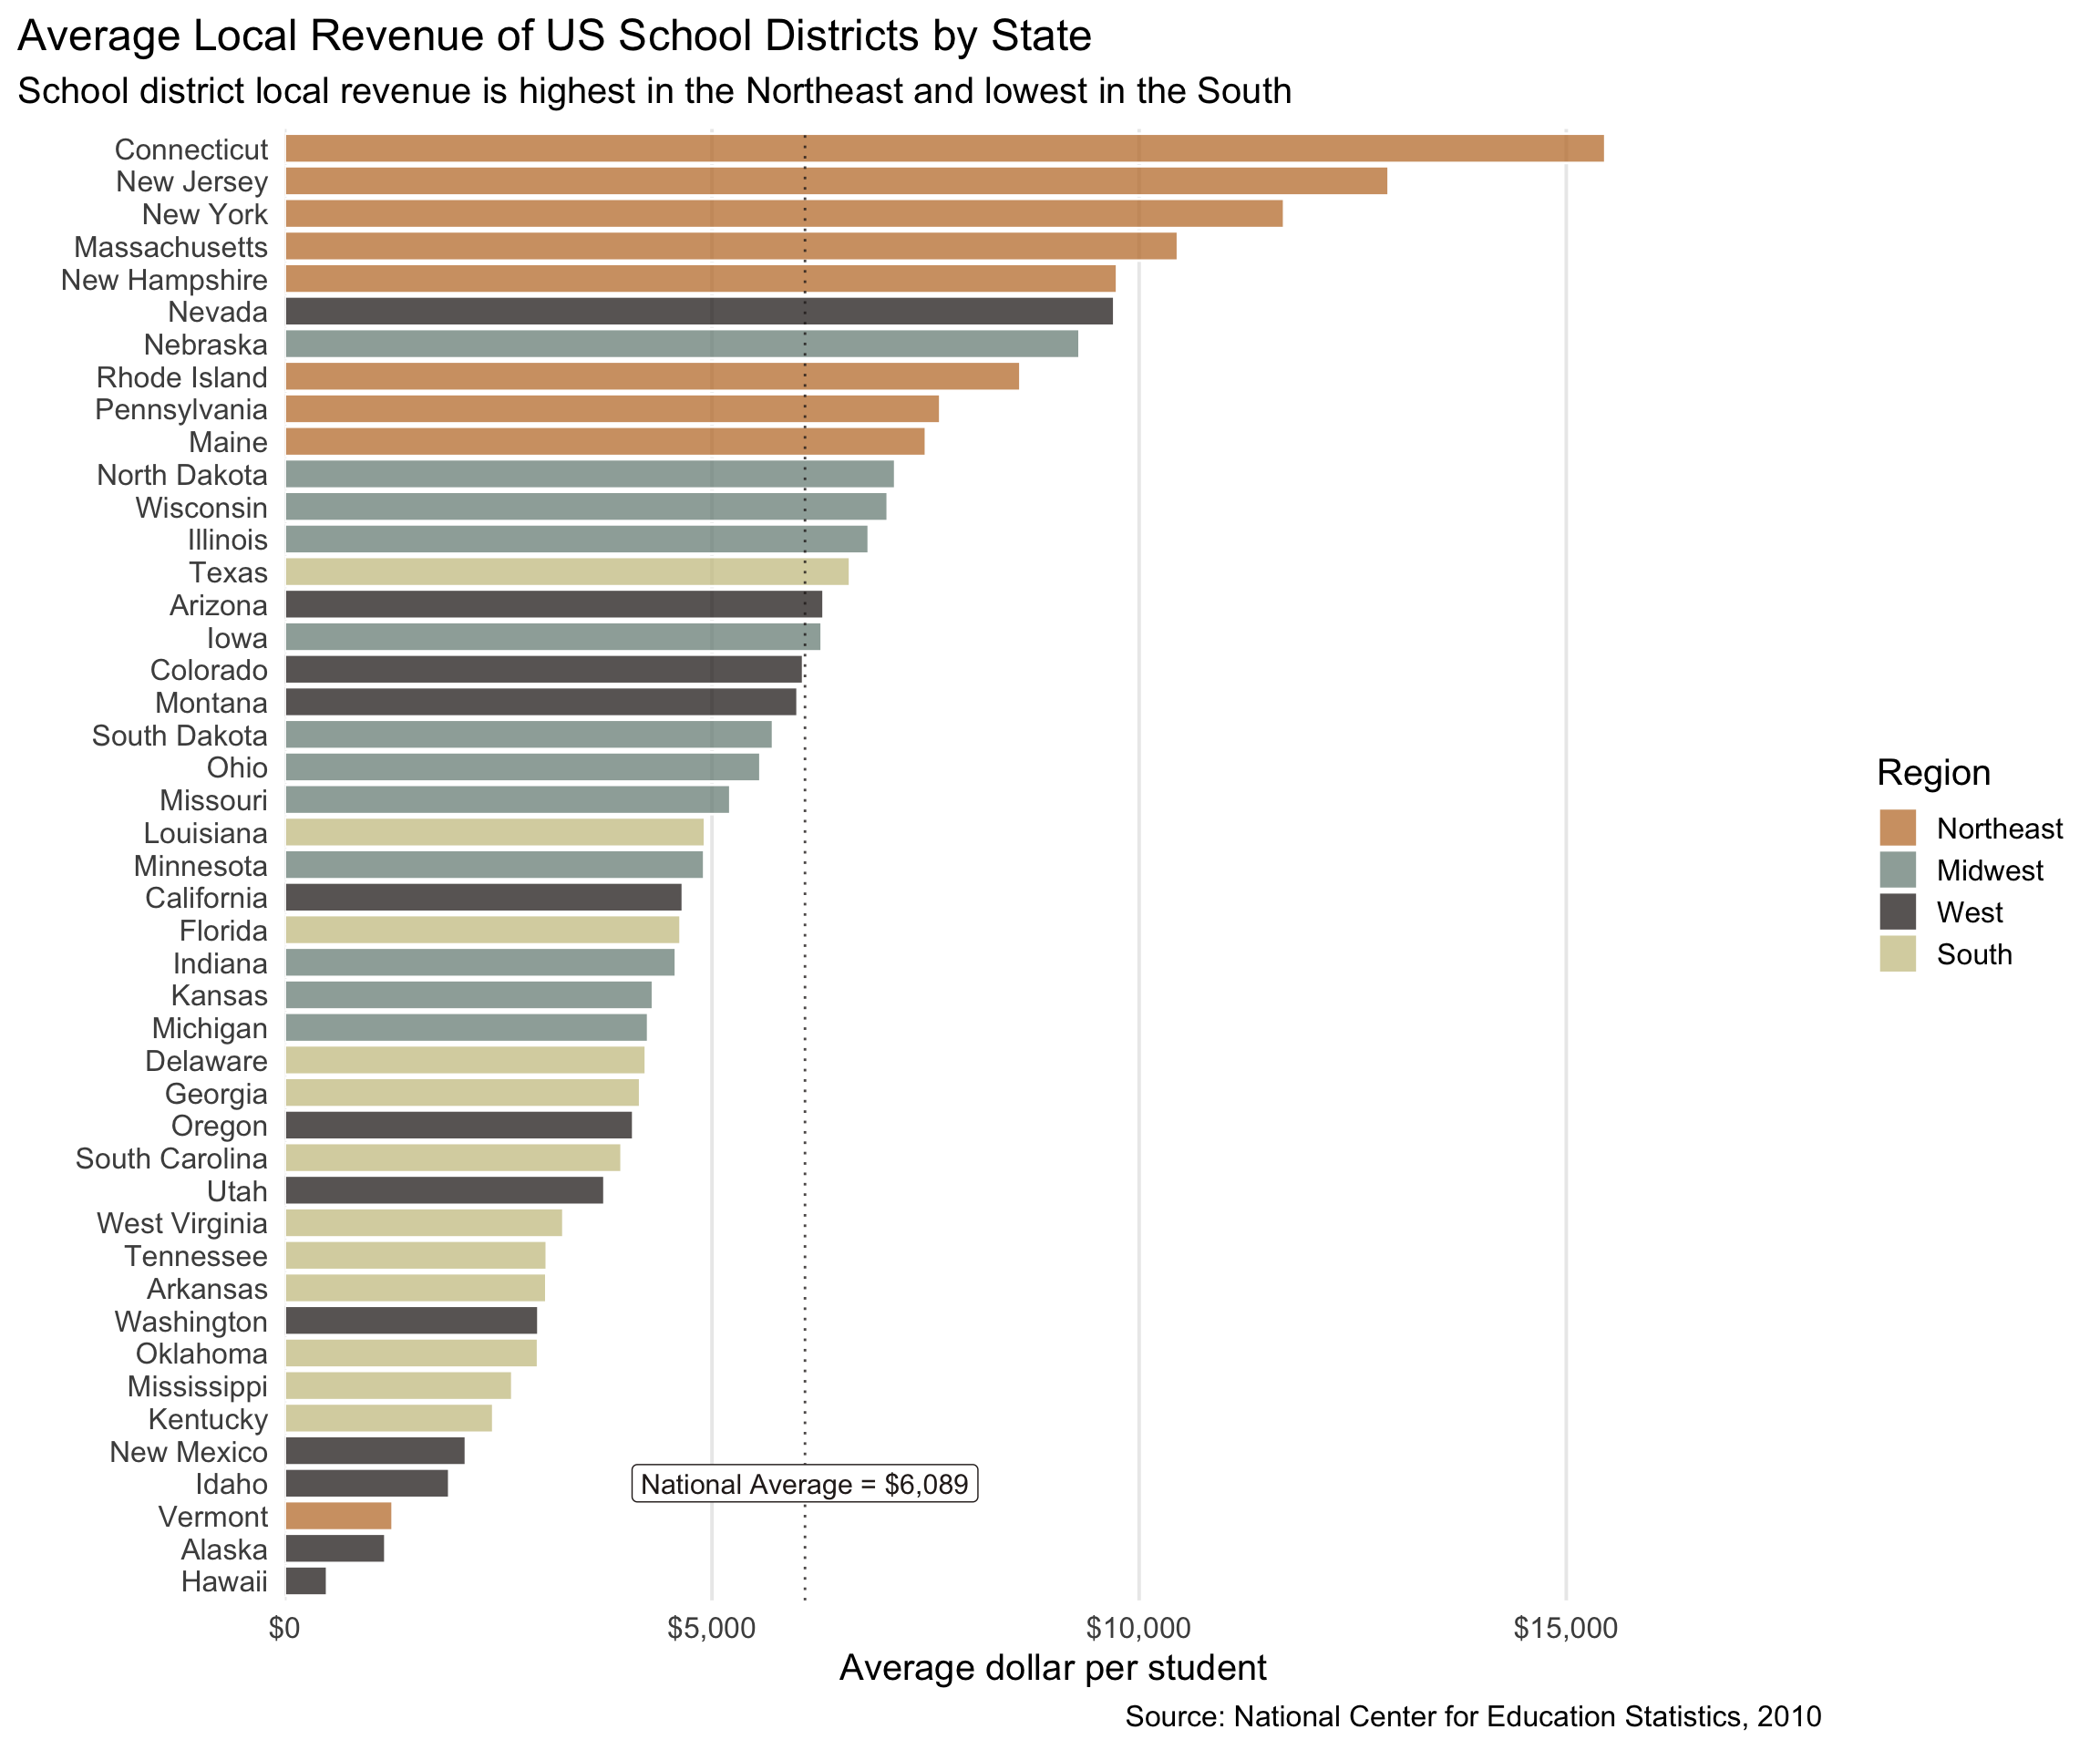
vertical bar plots: average local revenue of districts and reading proficiency across states
Bar plots illustrating average district local revenue (total and from property taxes) and reading/language arts proficiency of all students by state.
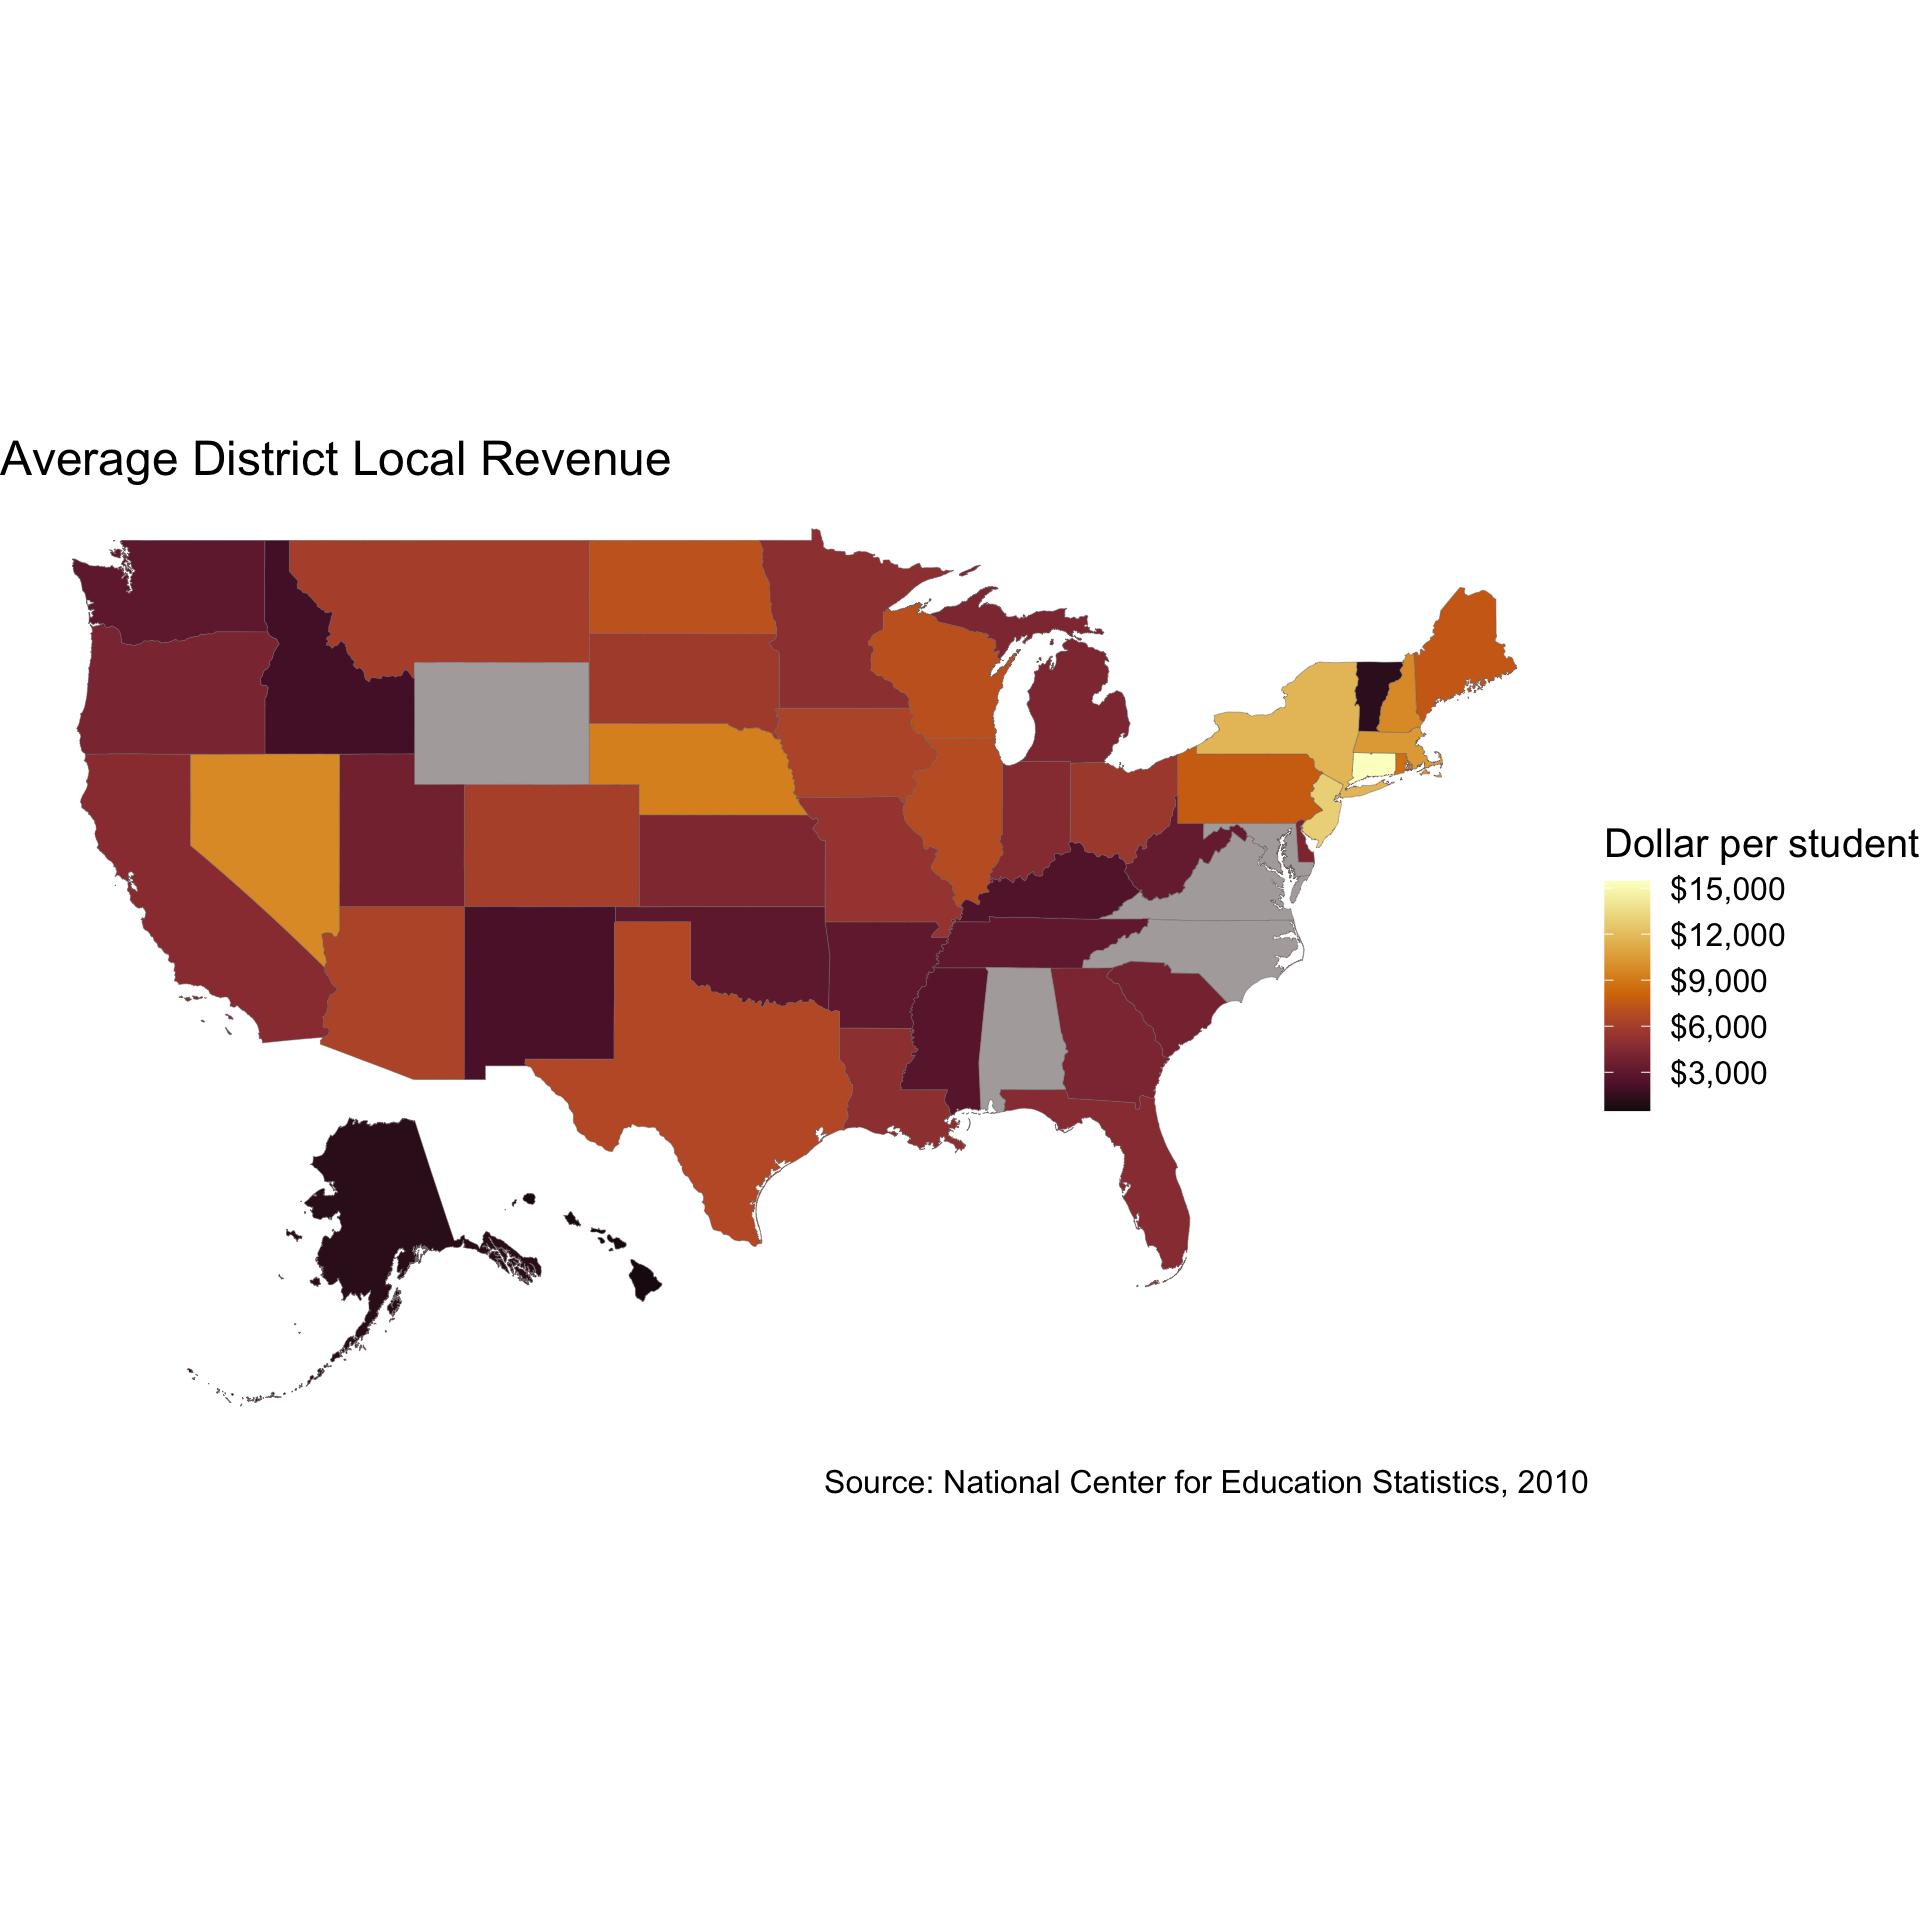
maps: average local revenue of districts across the US
Maps illustrating average district local revenue (total and from property taxes) in each US state.
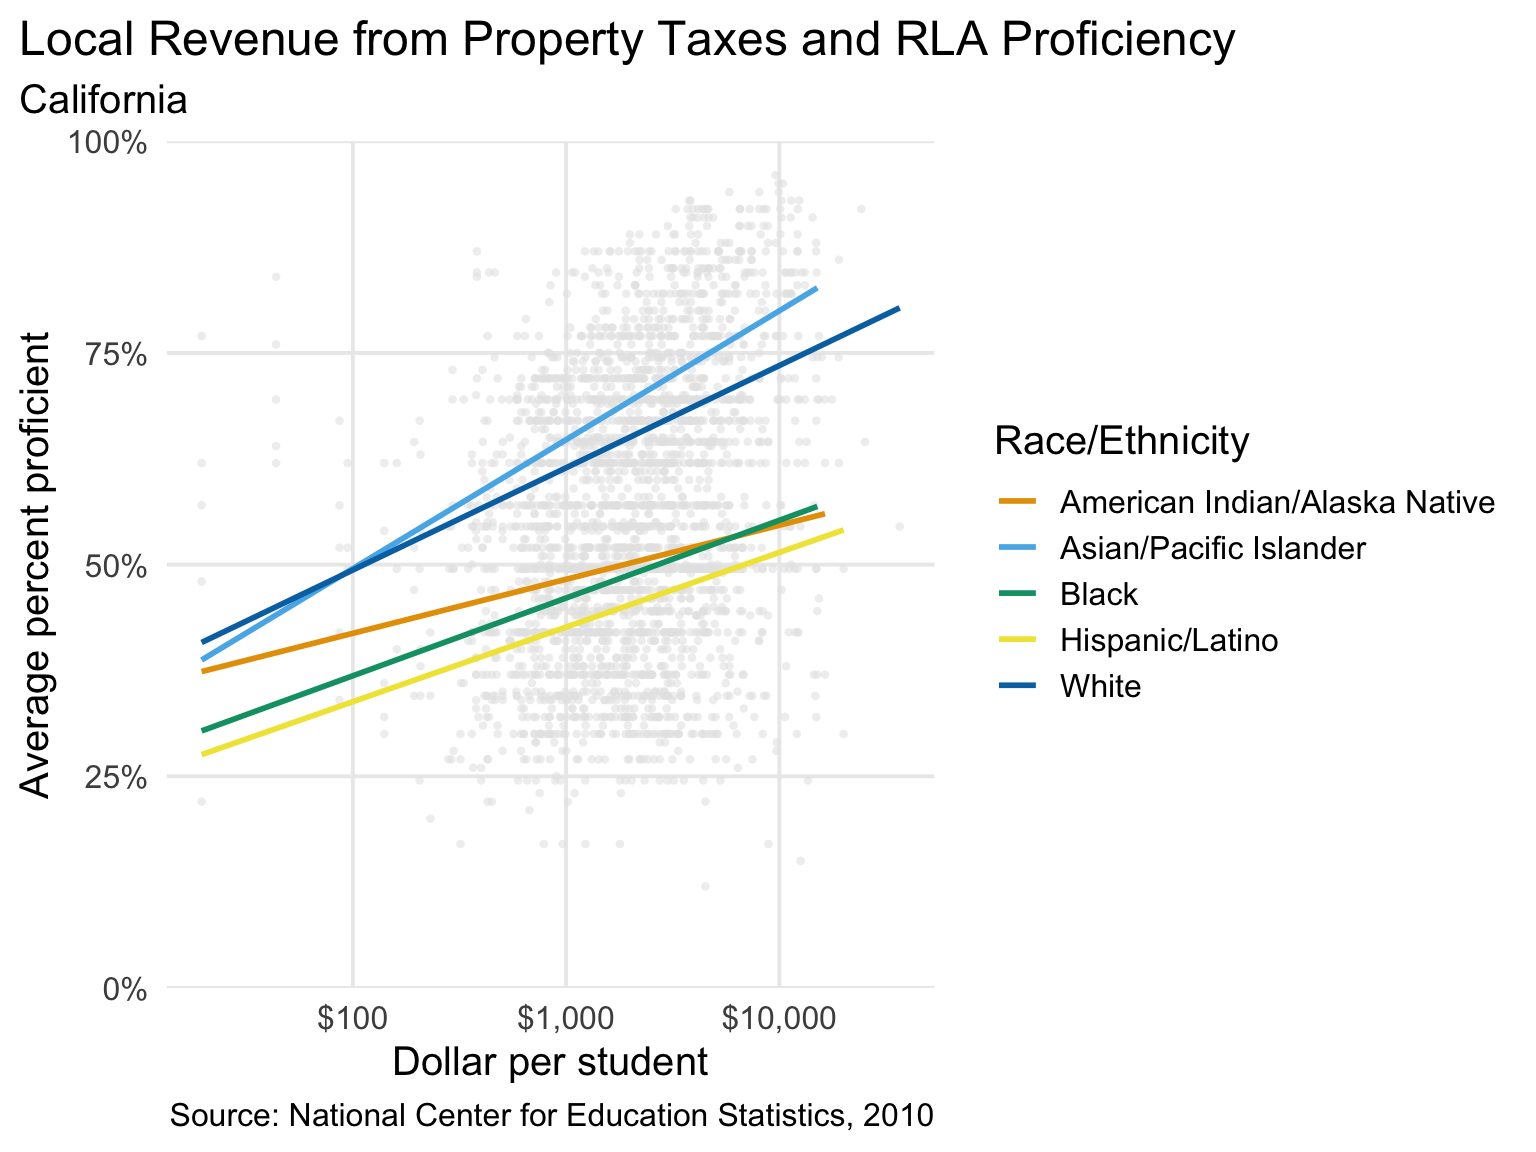
fitted lines: regional case studies of student race/ethnicity subgroup outcomes
The relationship between district property tax revenue and student reading outcomes by race and ethnicity subgroups was evaluated for a subset of four states, representing every US Census region.
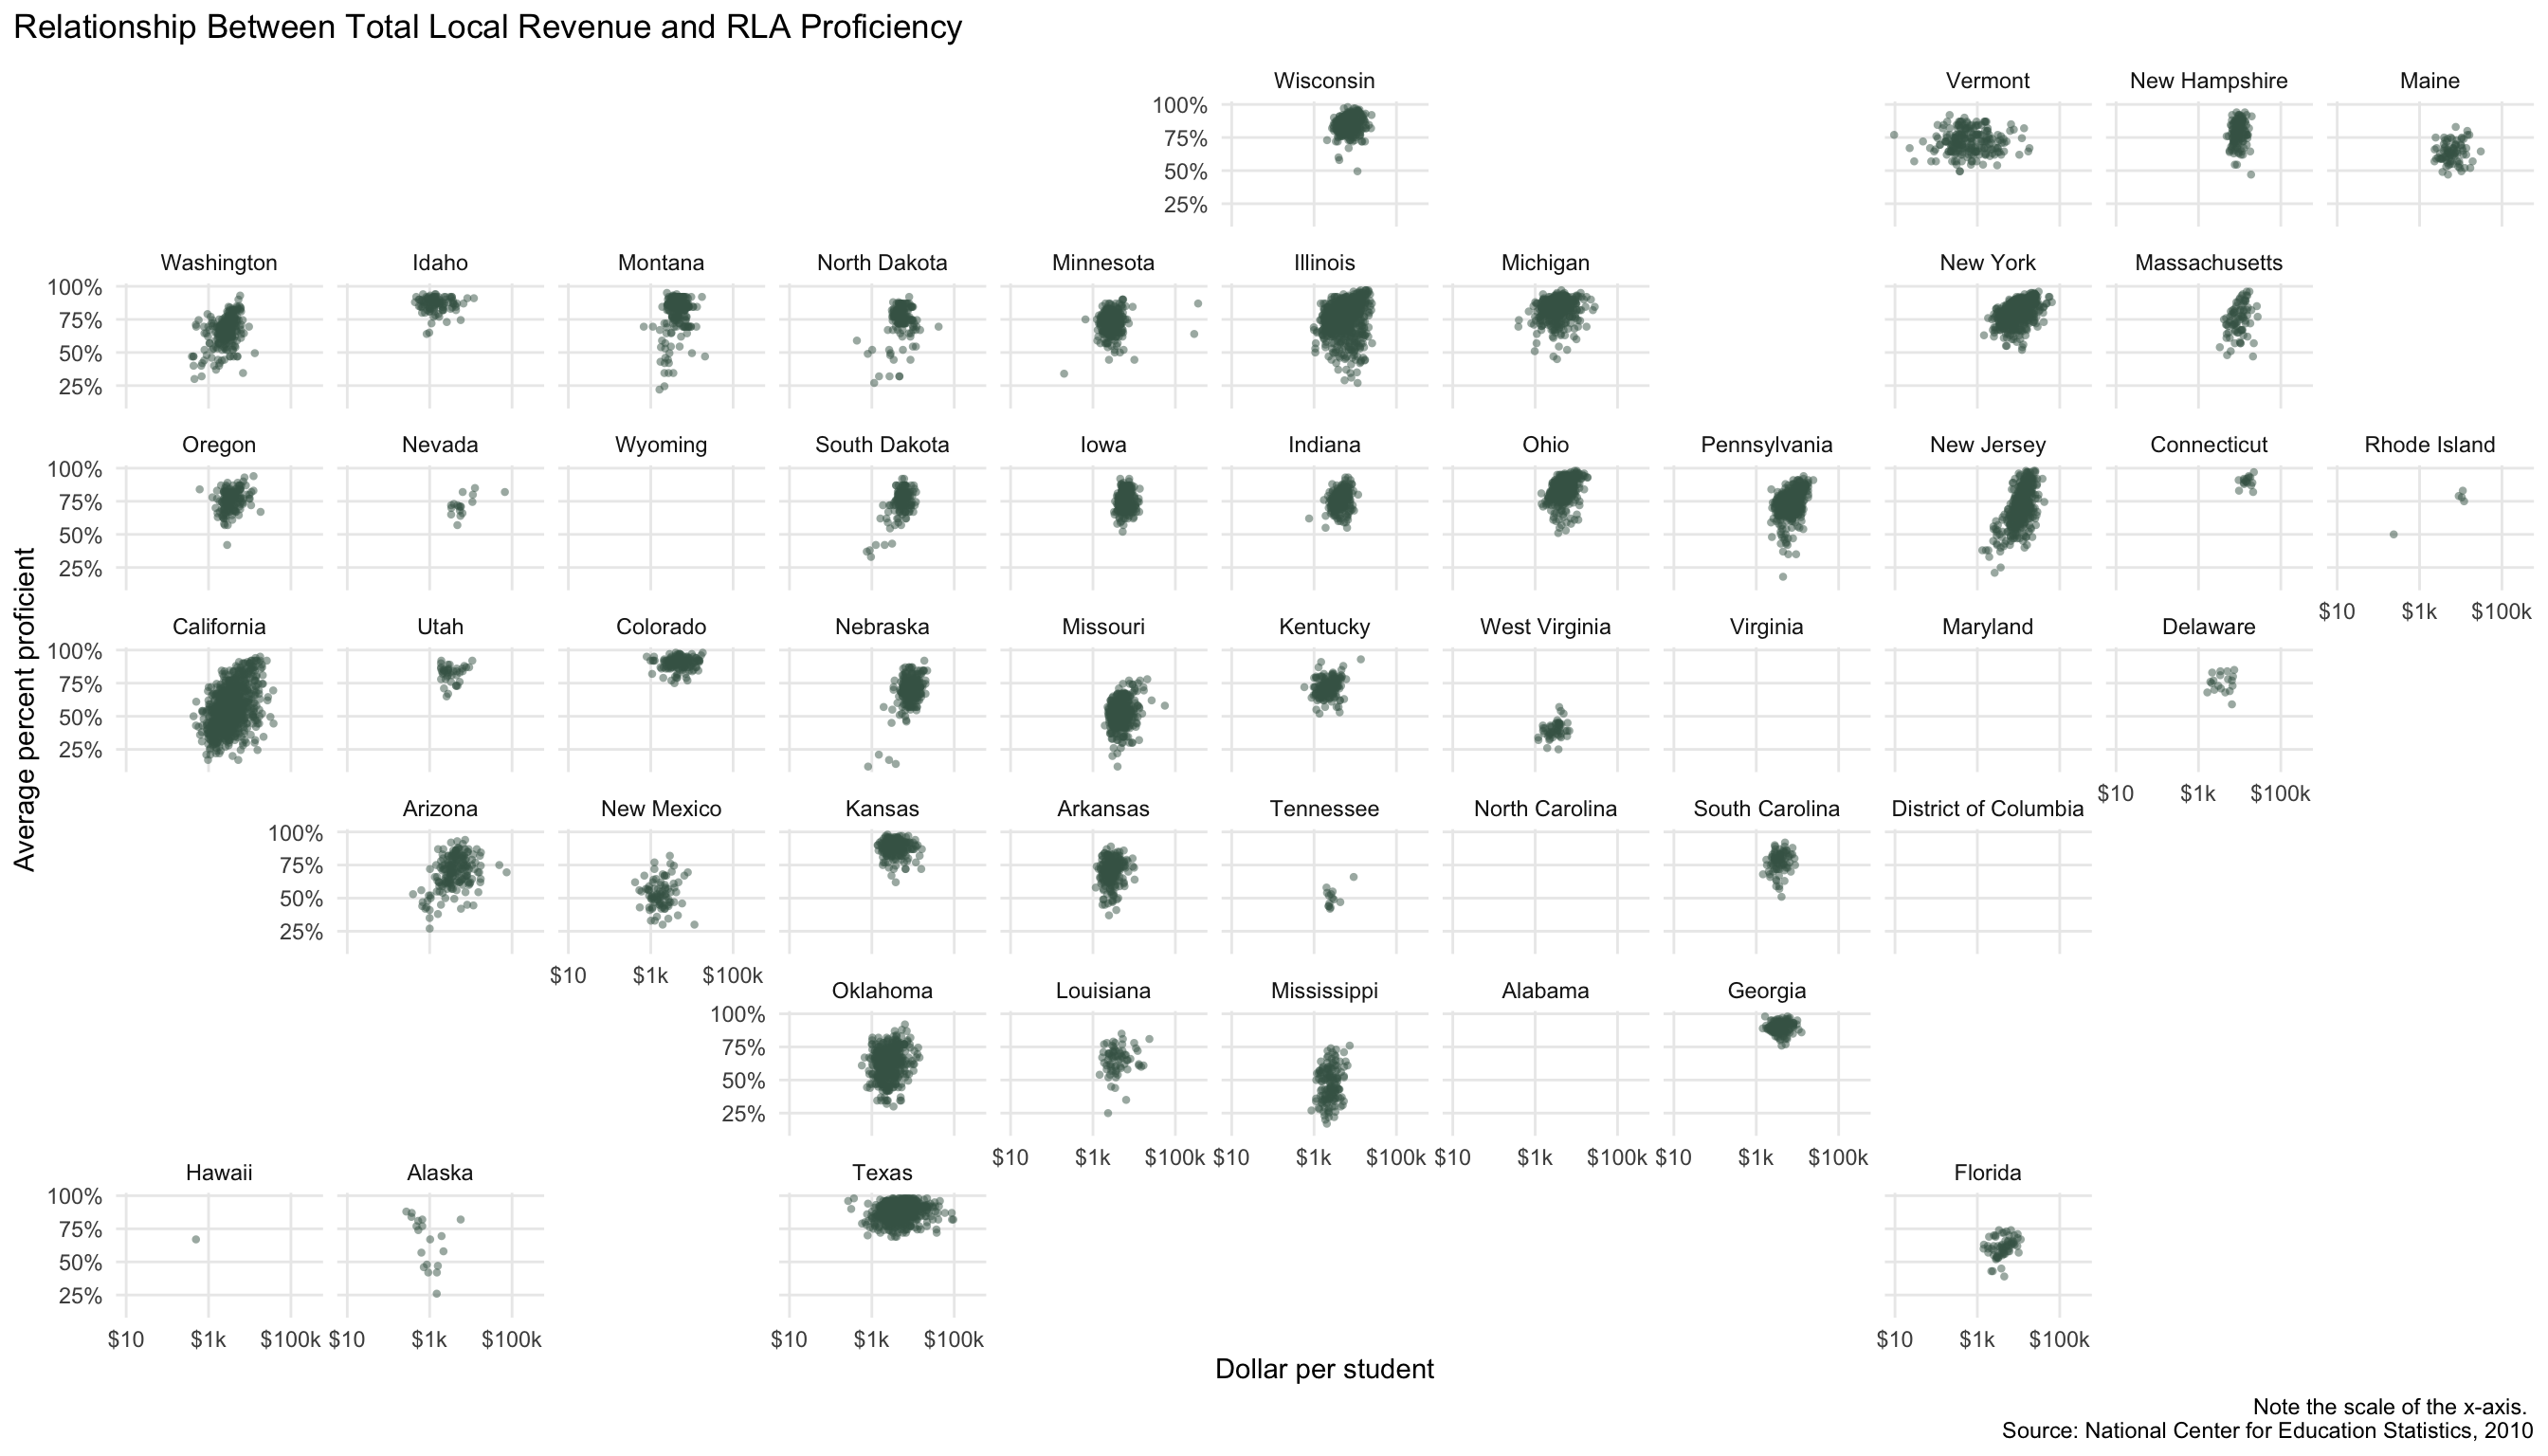
geo_facet with scatterplots: the relationship between local revenue and student reading proficiency
Scatterplots for each state illustrating the relationship between district local revenue (total and from property taxes) and student reading/language arts profiency.
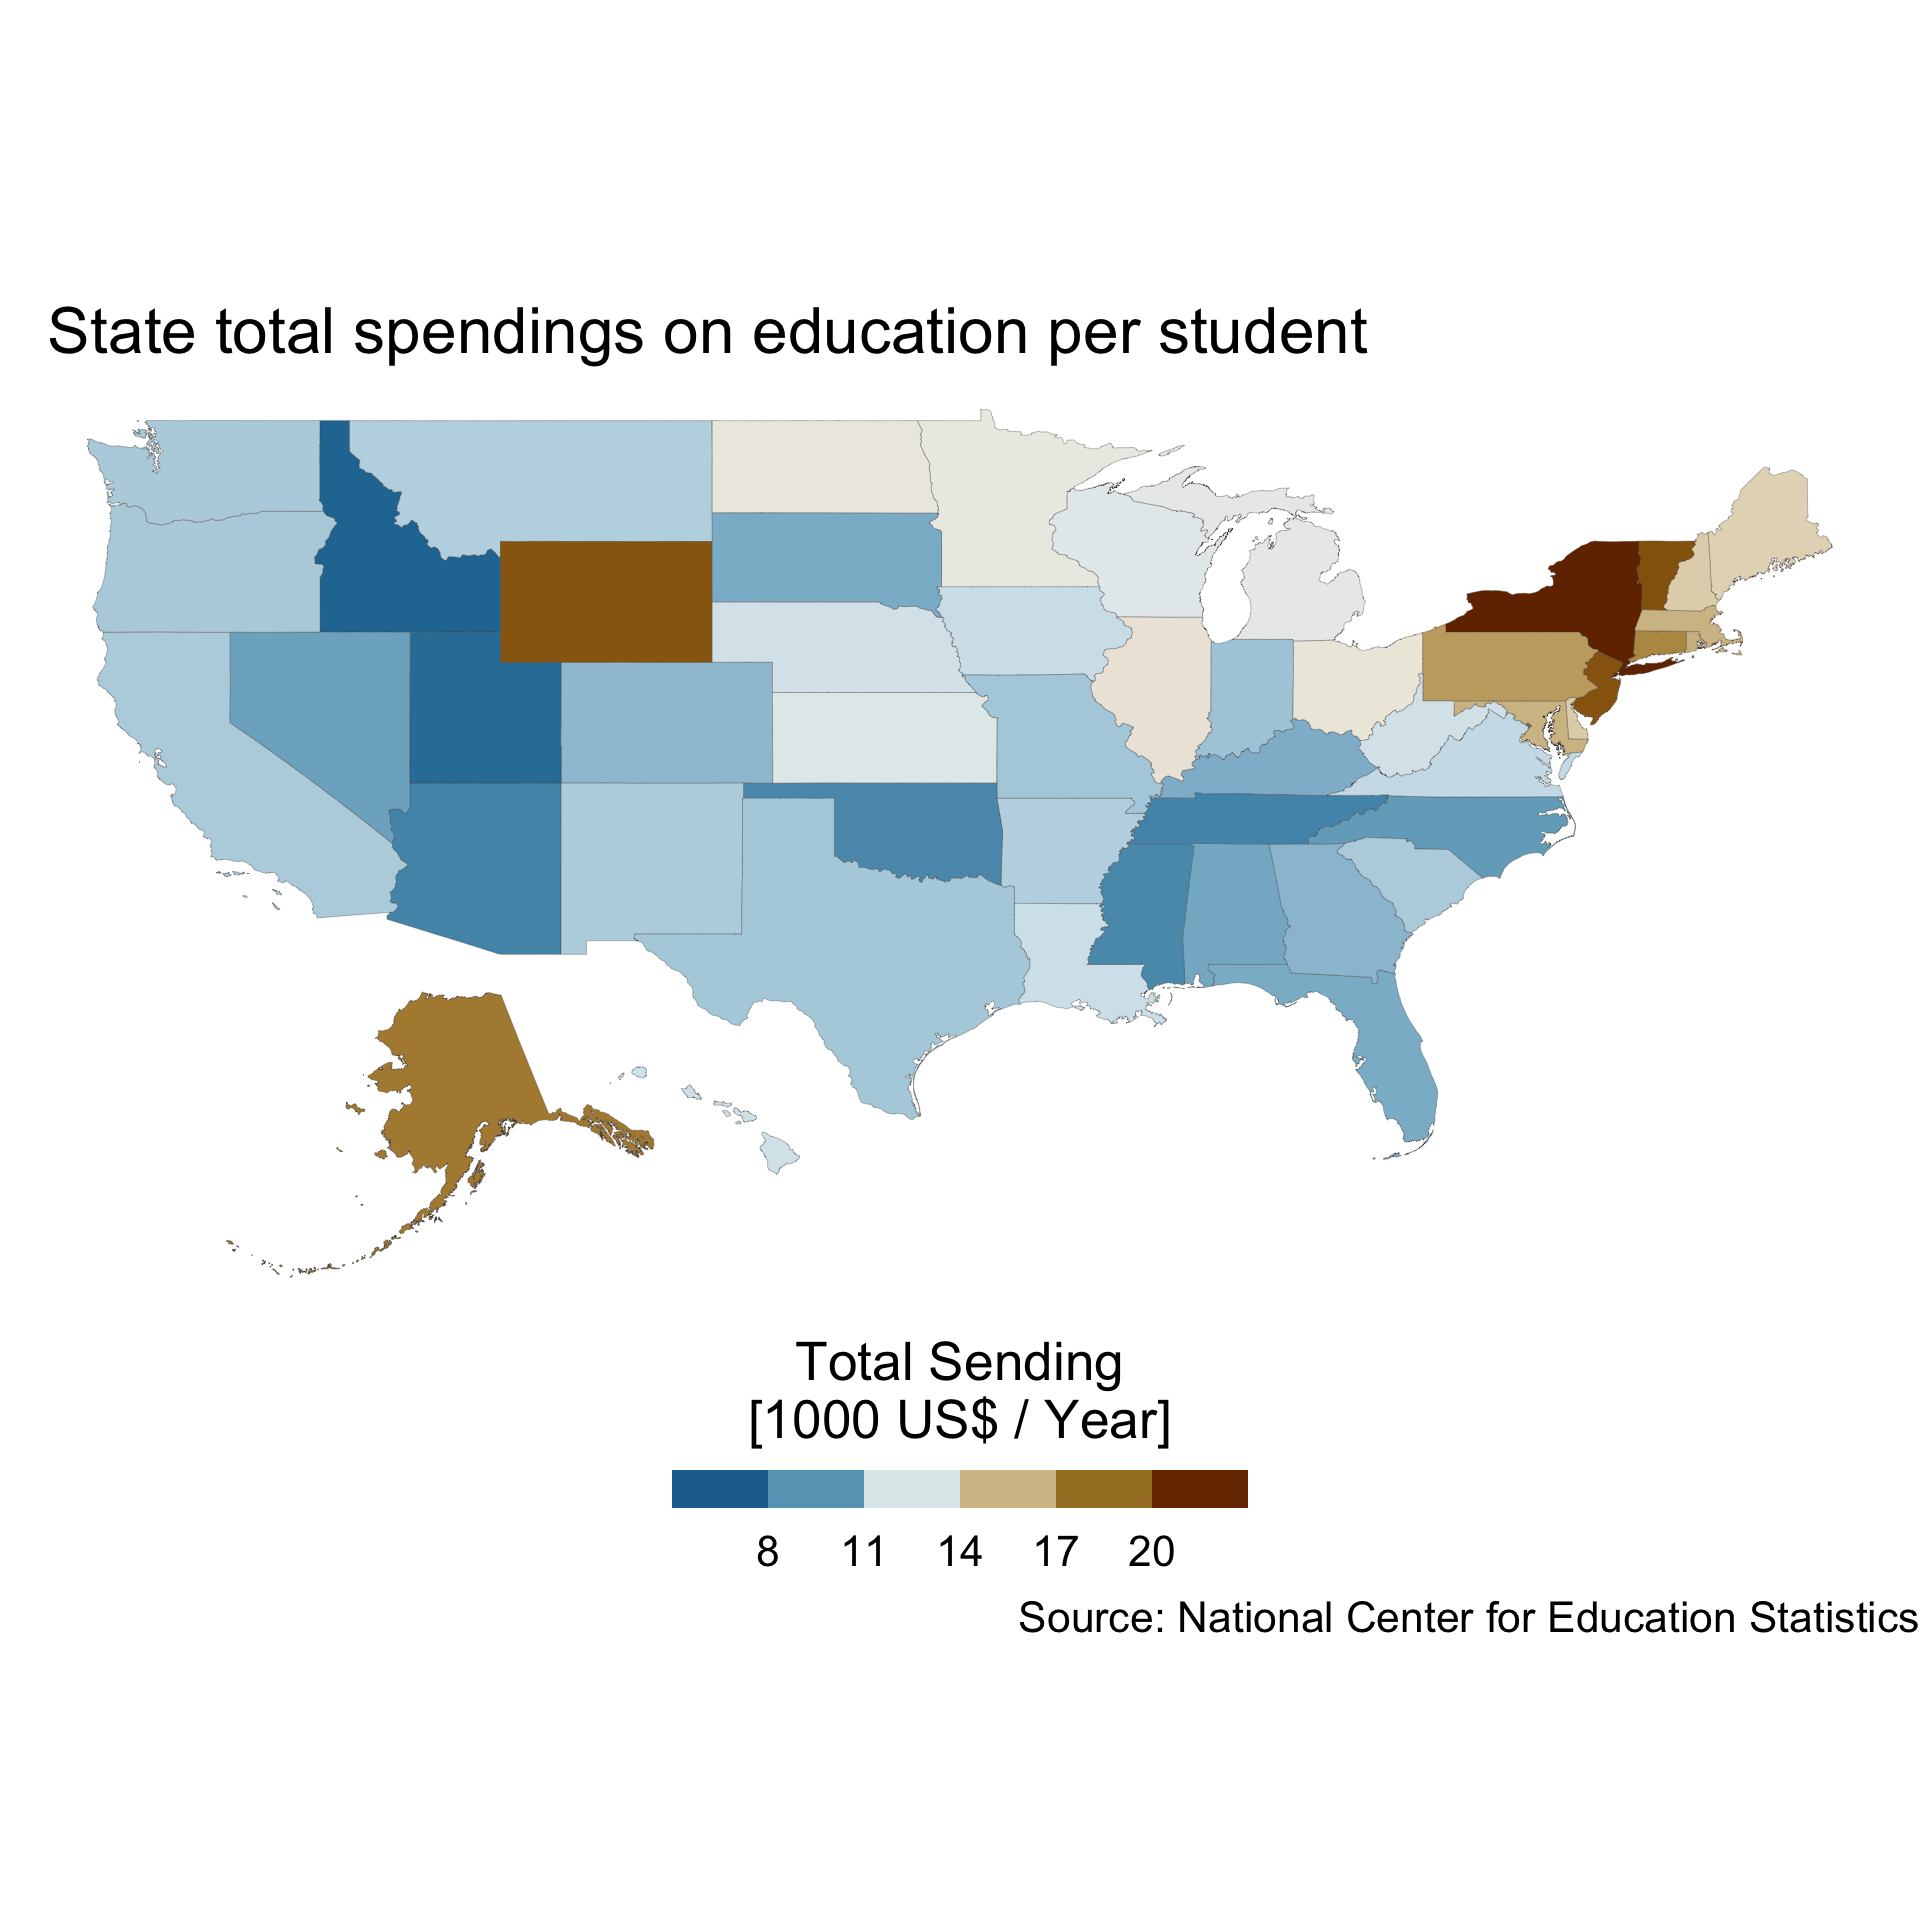
Maps: variation in educational spending by state
Geographical representation of the expenditures by state
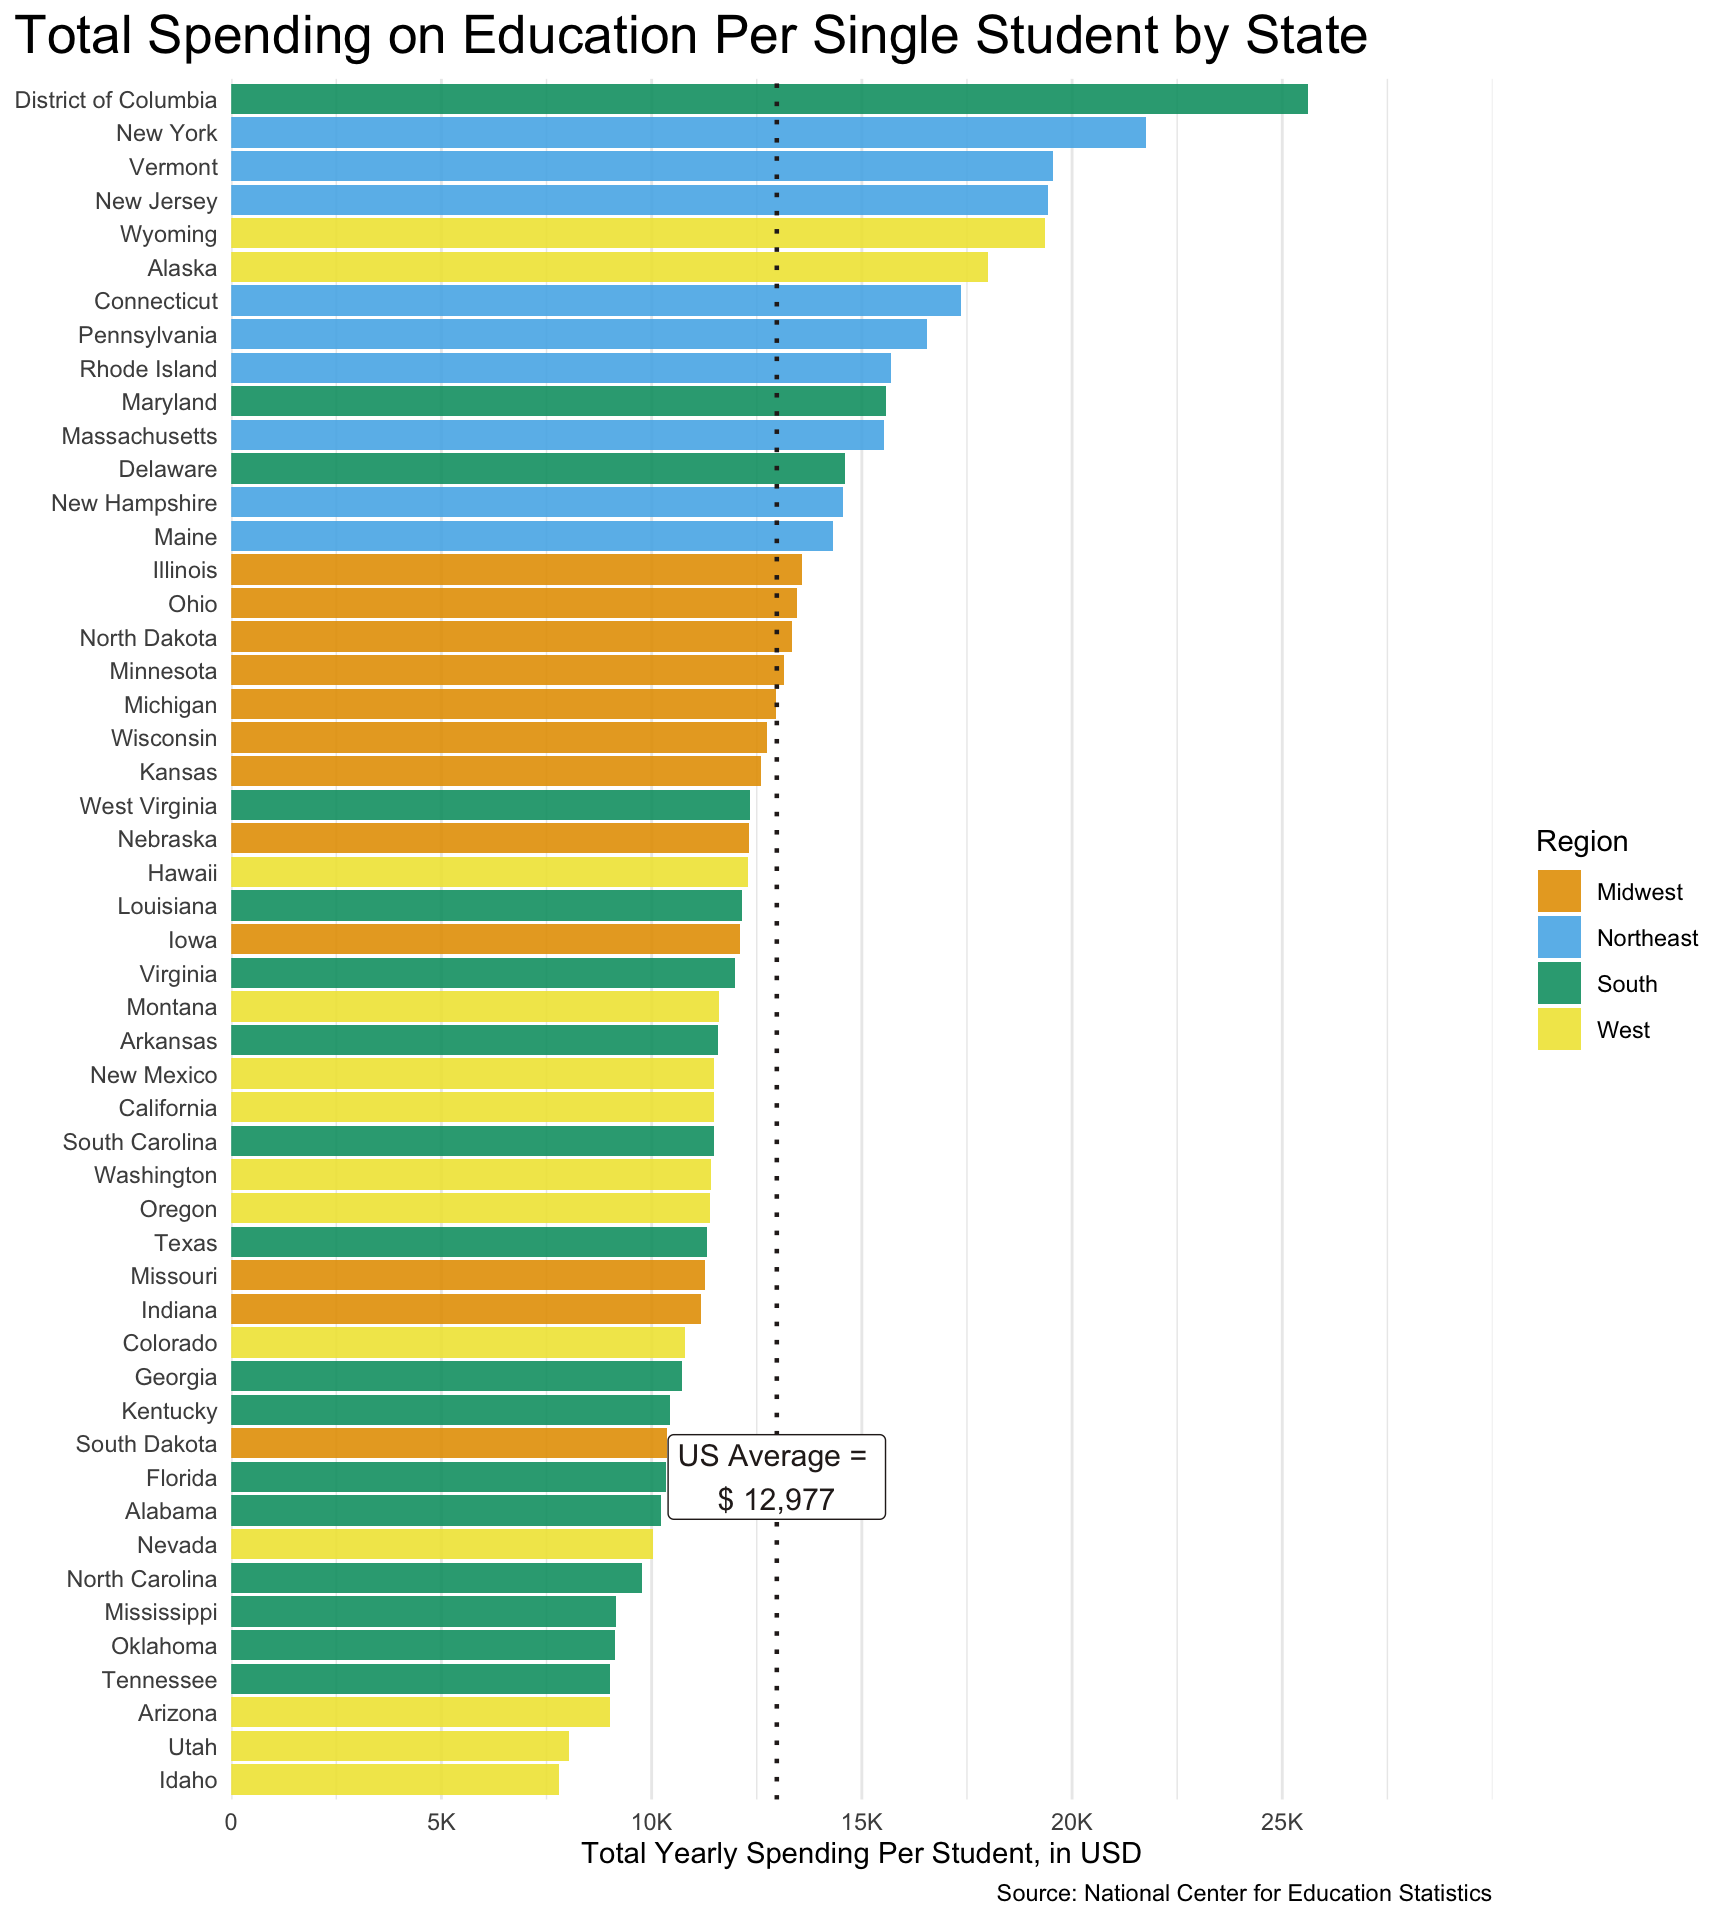
Total spending on education per student
How much does each state spend total yearly per single student?
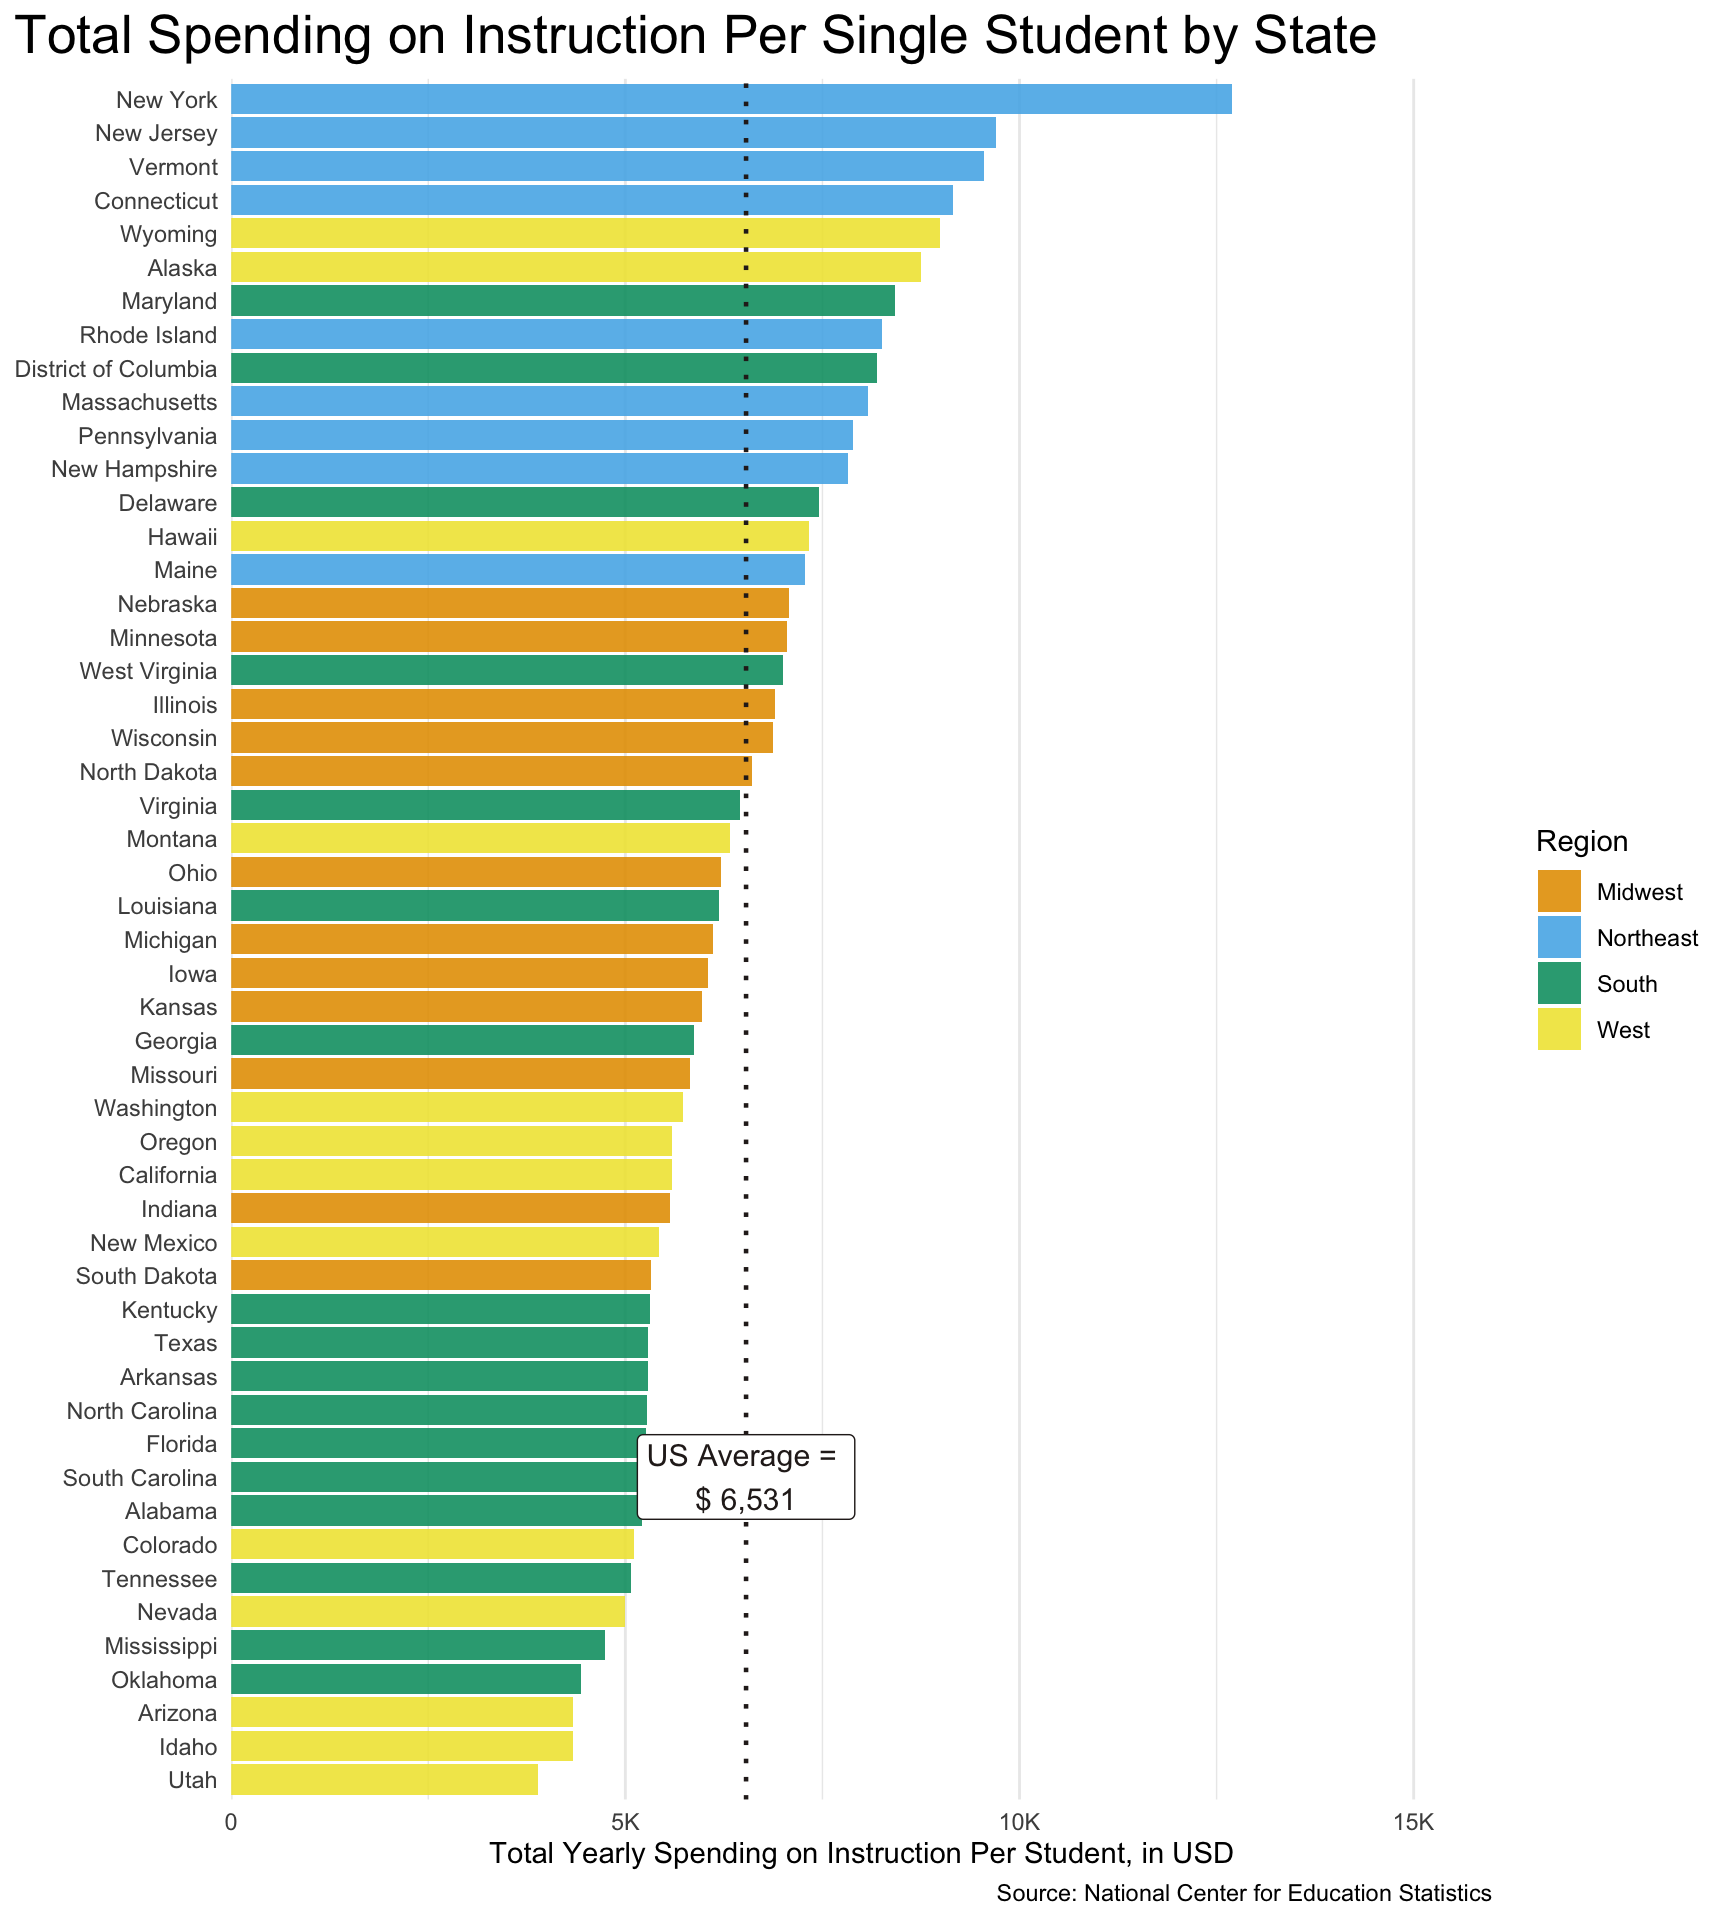
Total spending on instruction, special education, and textbooks by state
How much does each state spend on instruction, special education, and textbooks?
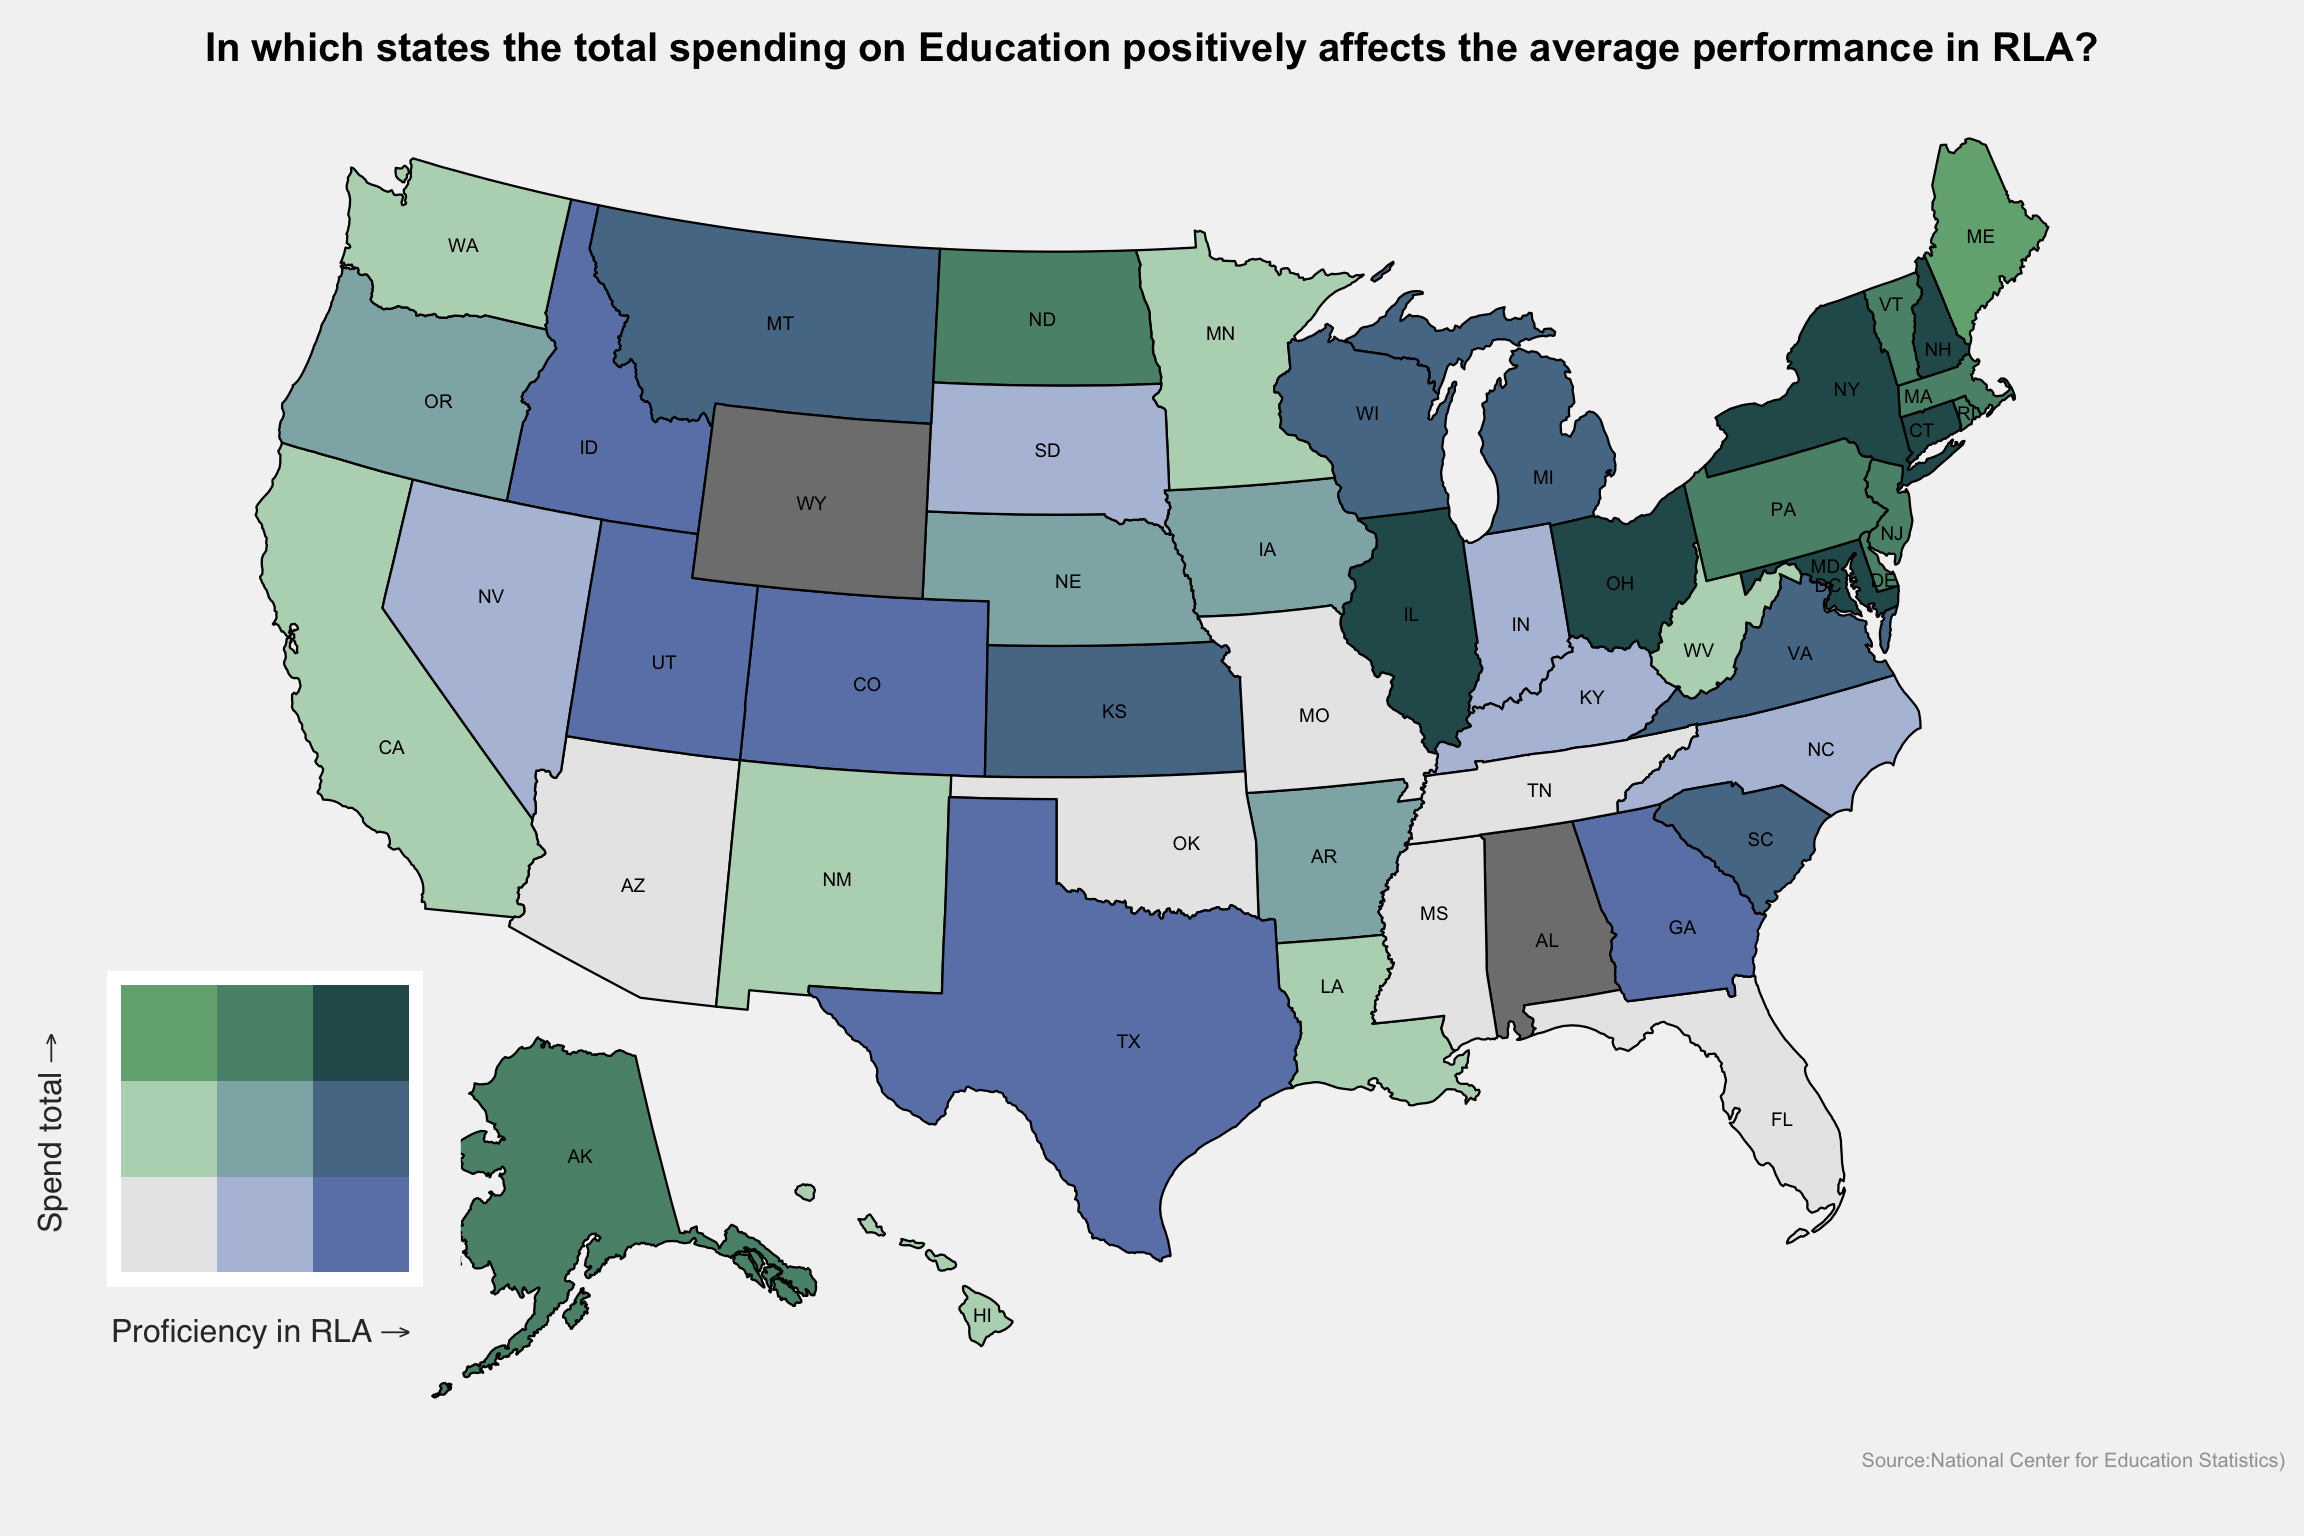
Bivariate maps: relationship between education spending and students' performance
Does increased spending on education result in improved students' performance?
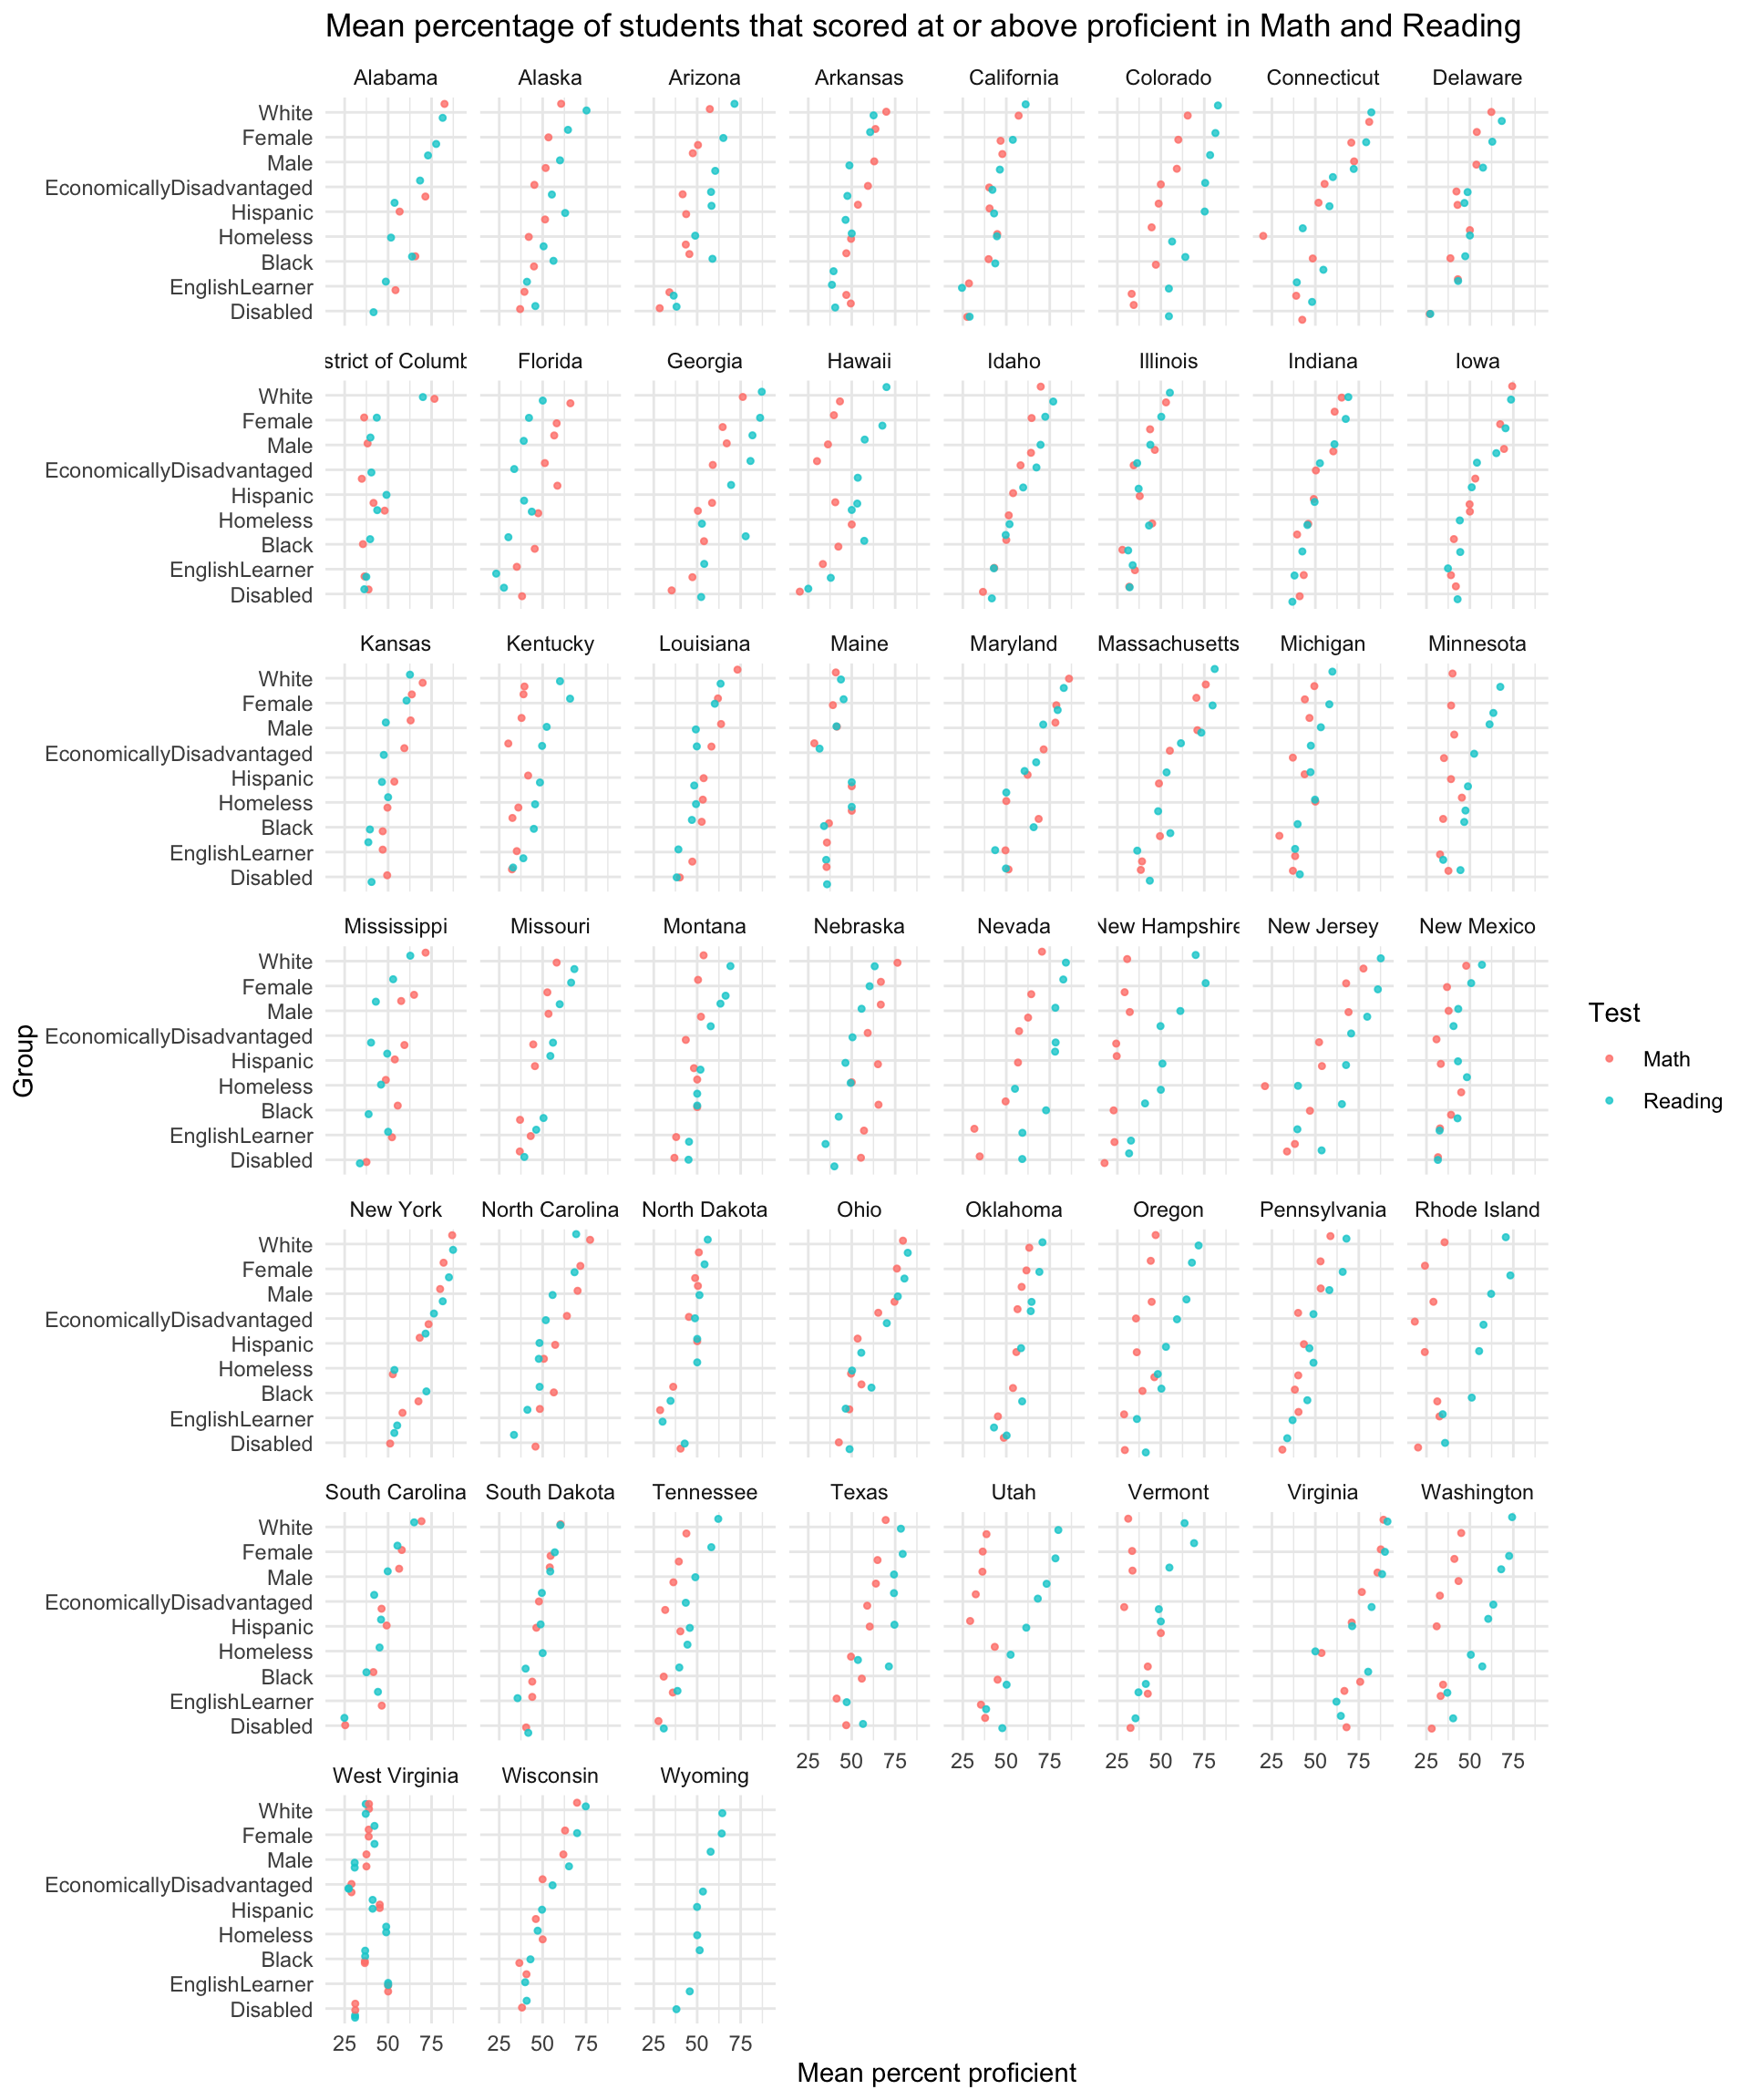
geom_jitter: mean test score by students' subgroup and test(math or reading) by state
Plot showing mean test score by subgroup and test by state
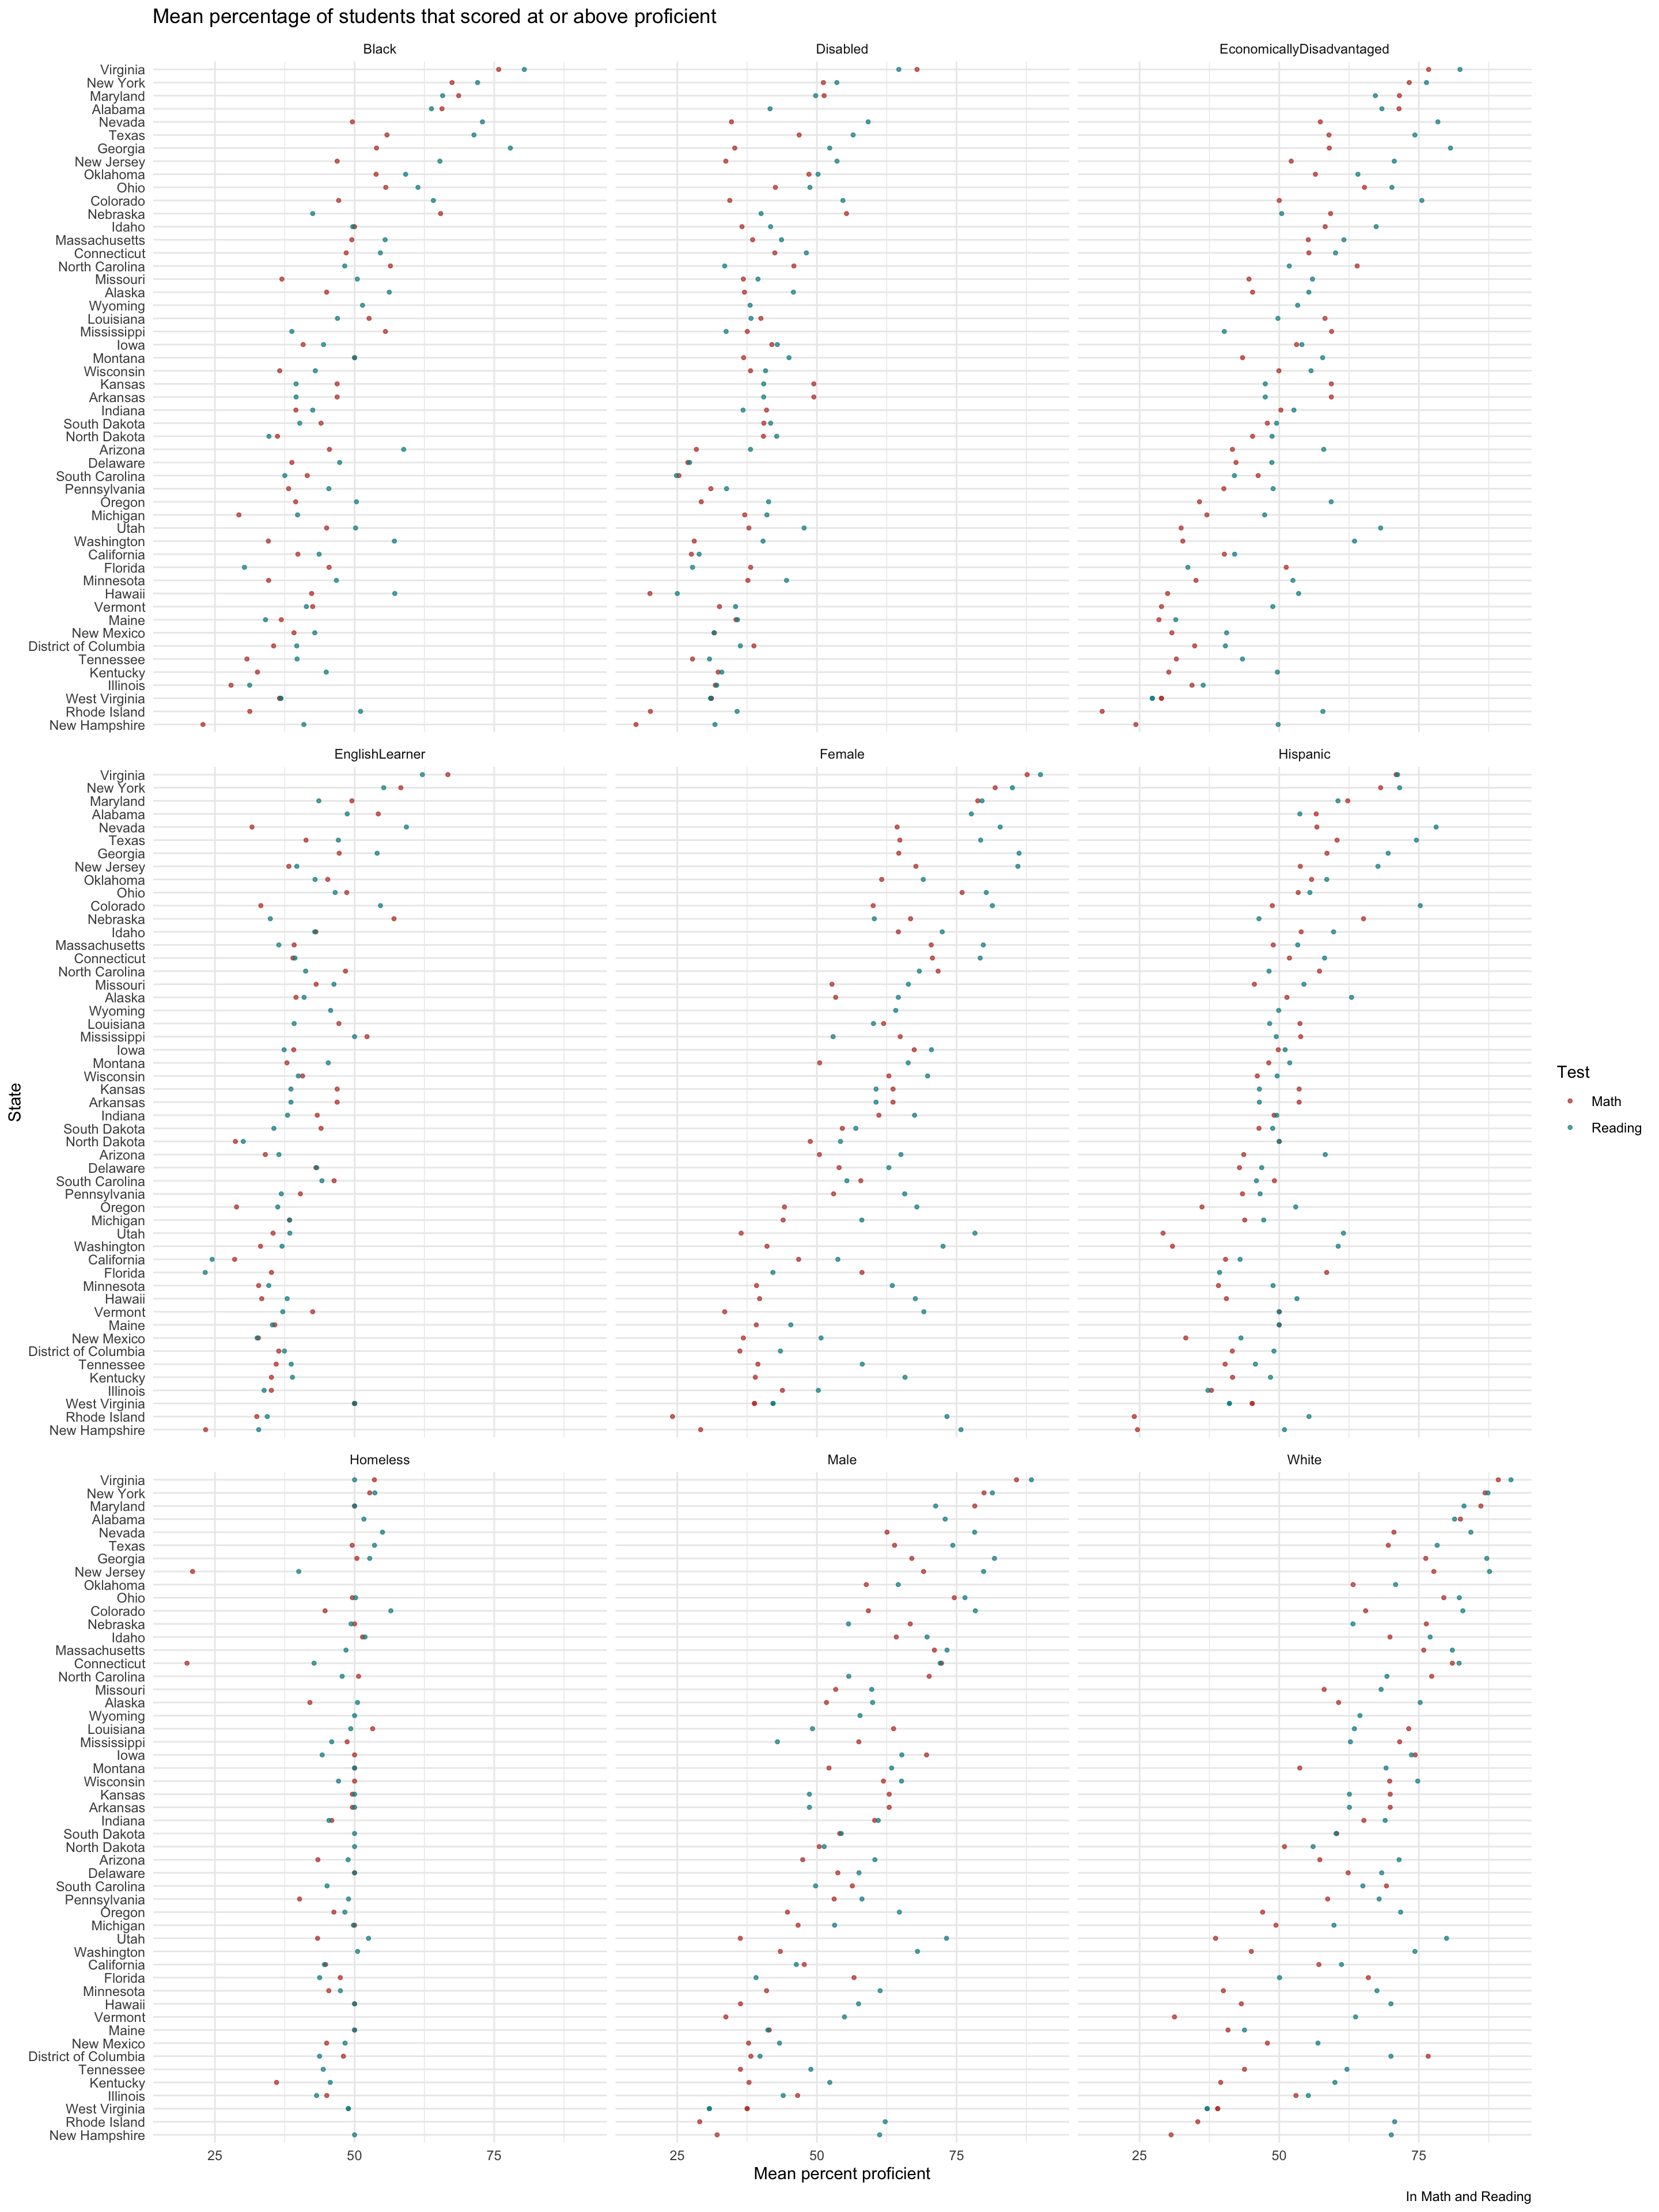
geom_point: mean test score by subgroup and test
Mean percentage of students that scored at or above proficient in math and reading
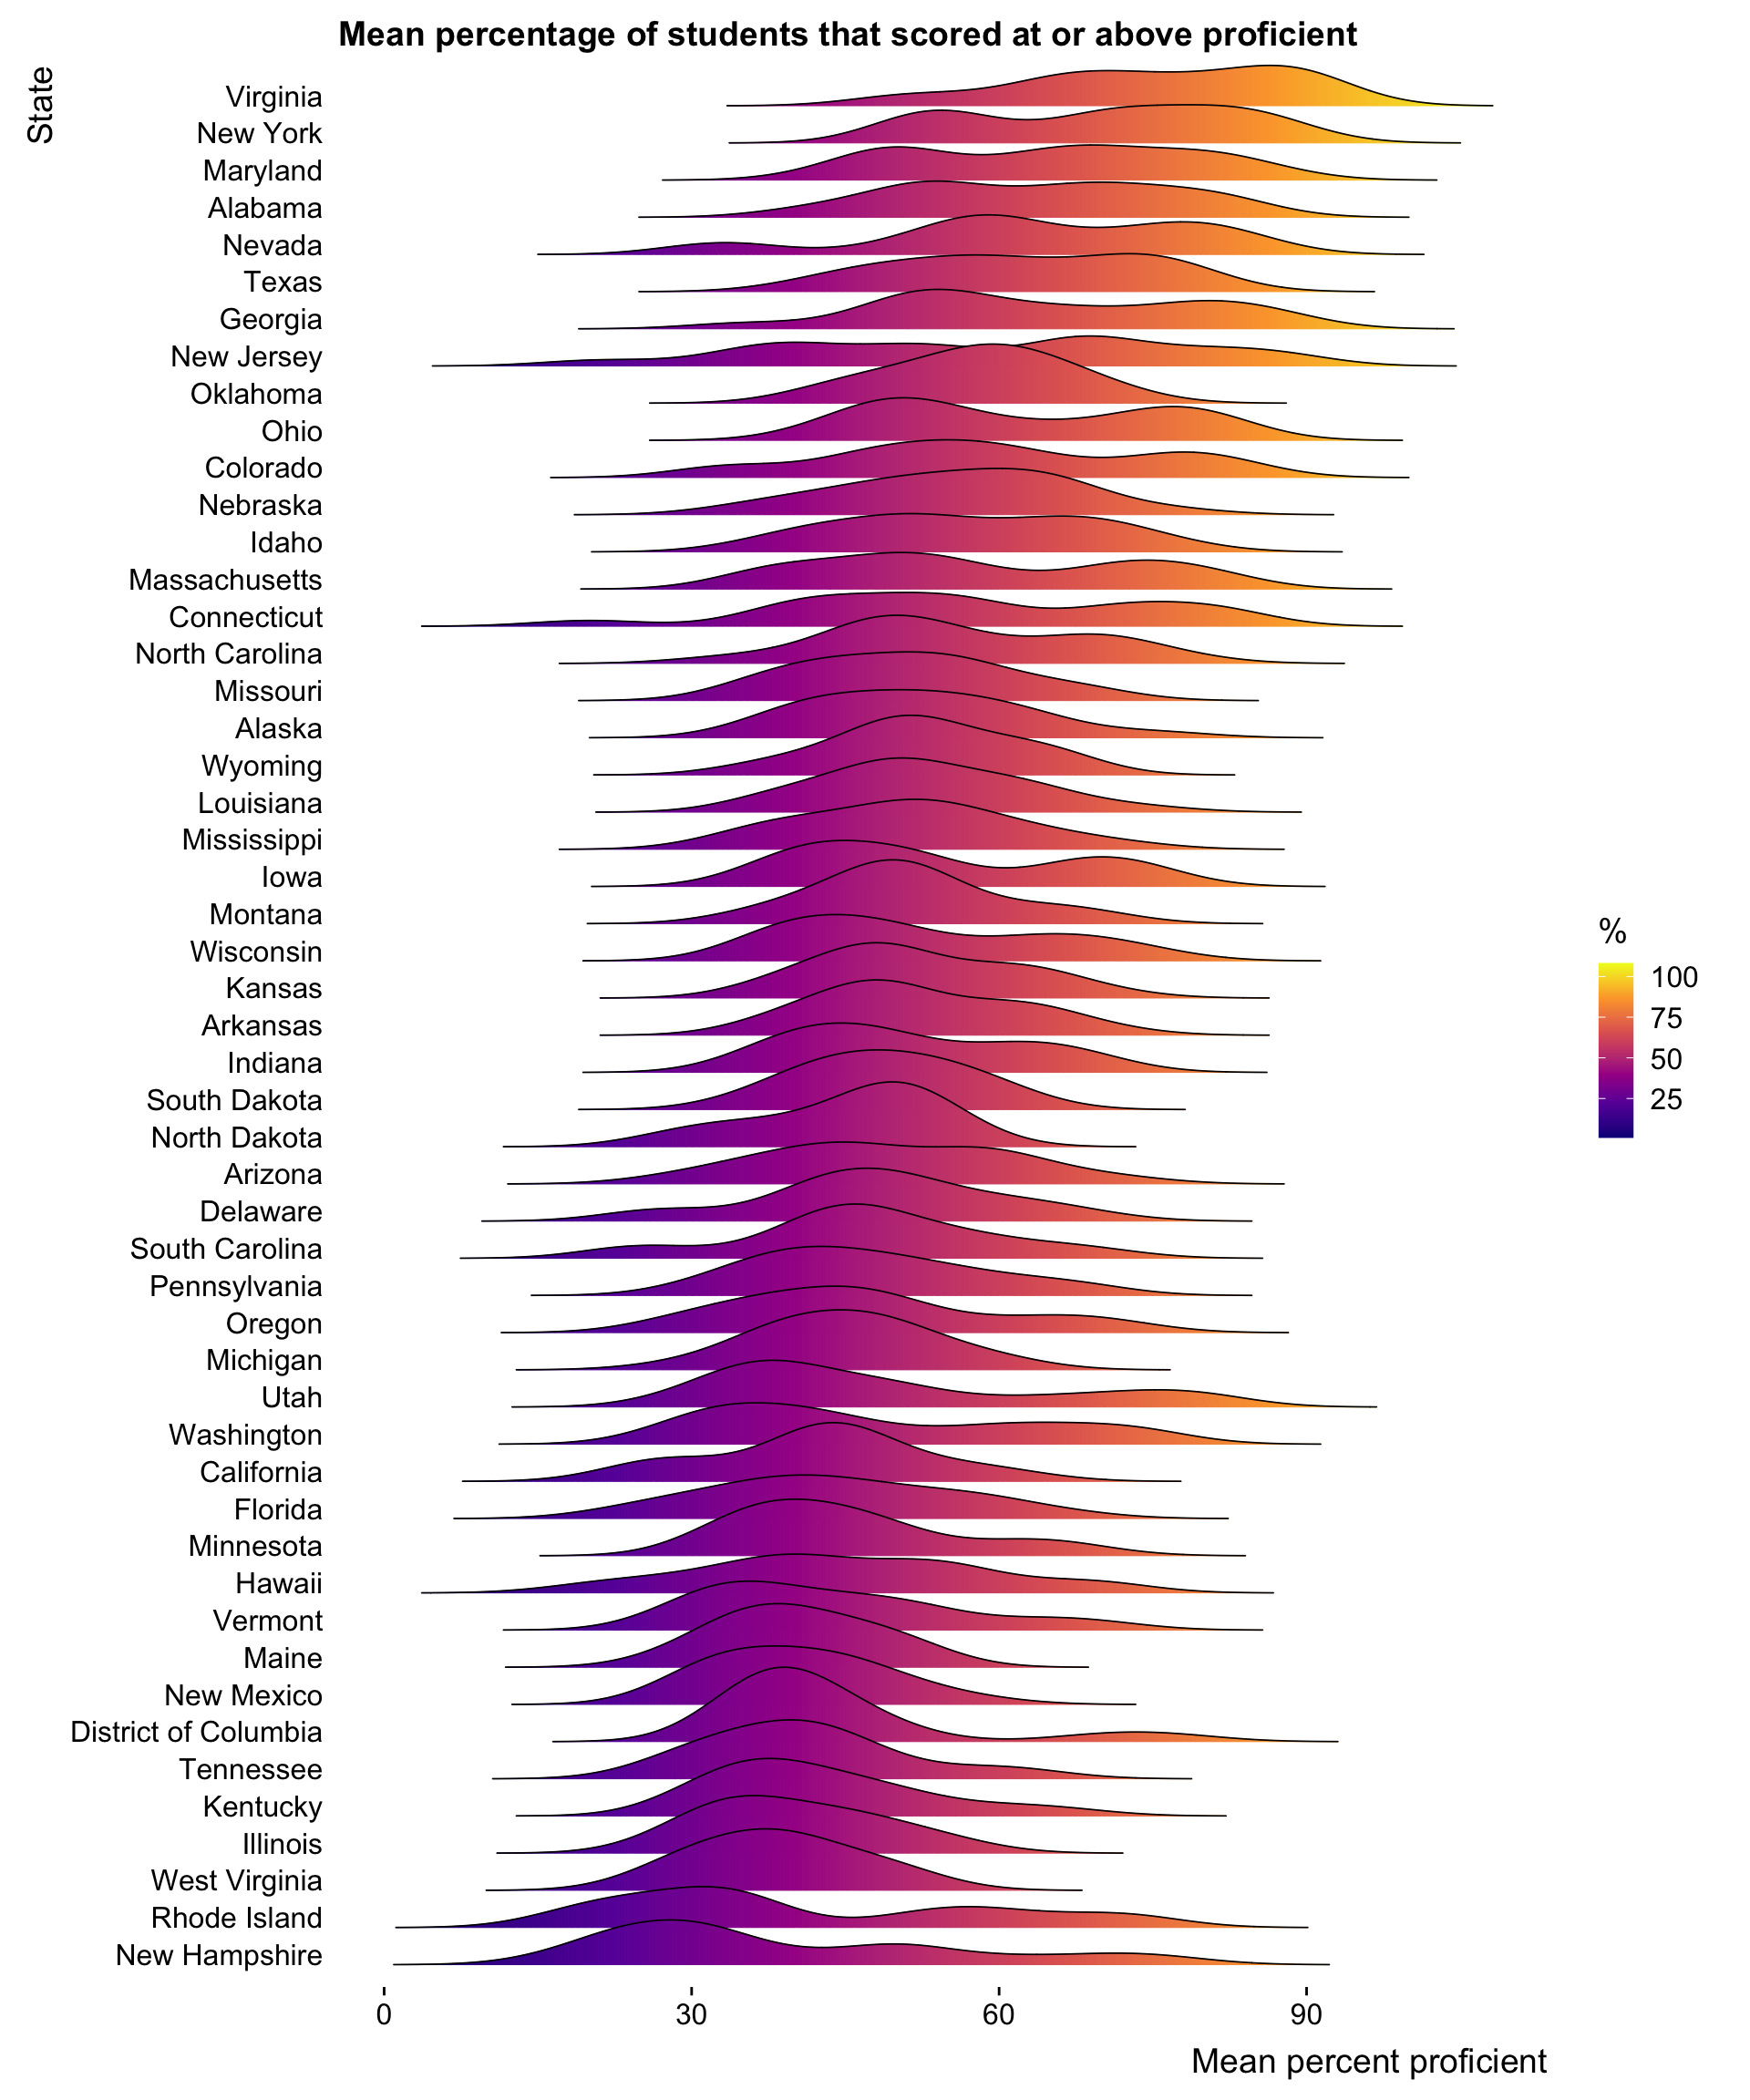
ggridges: mean test scores above or at proficent by state
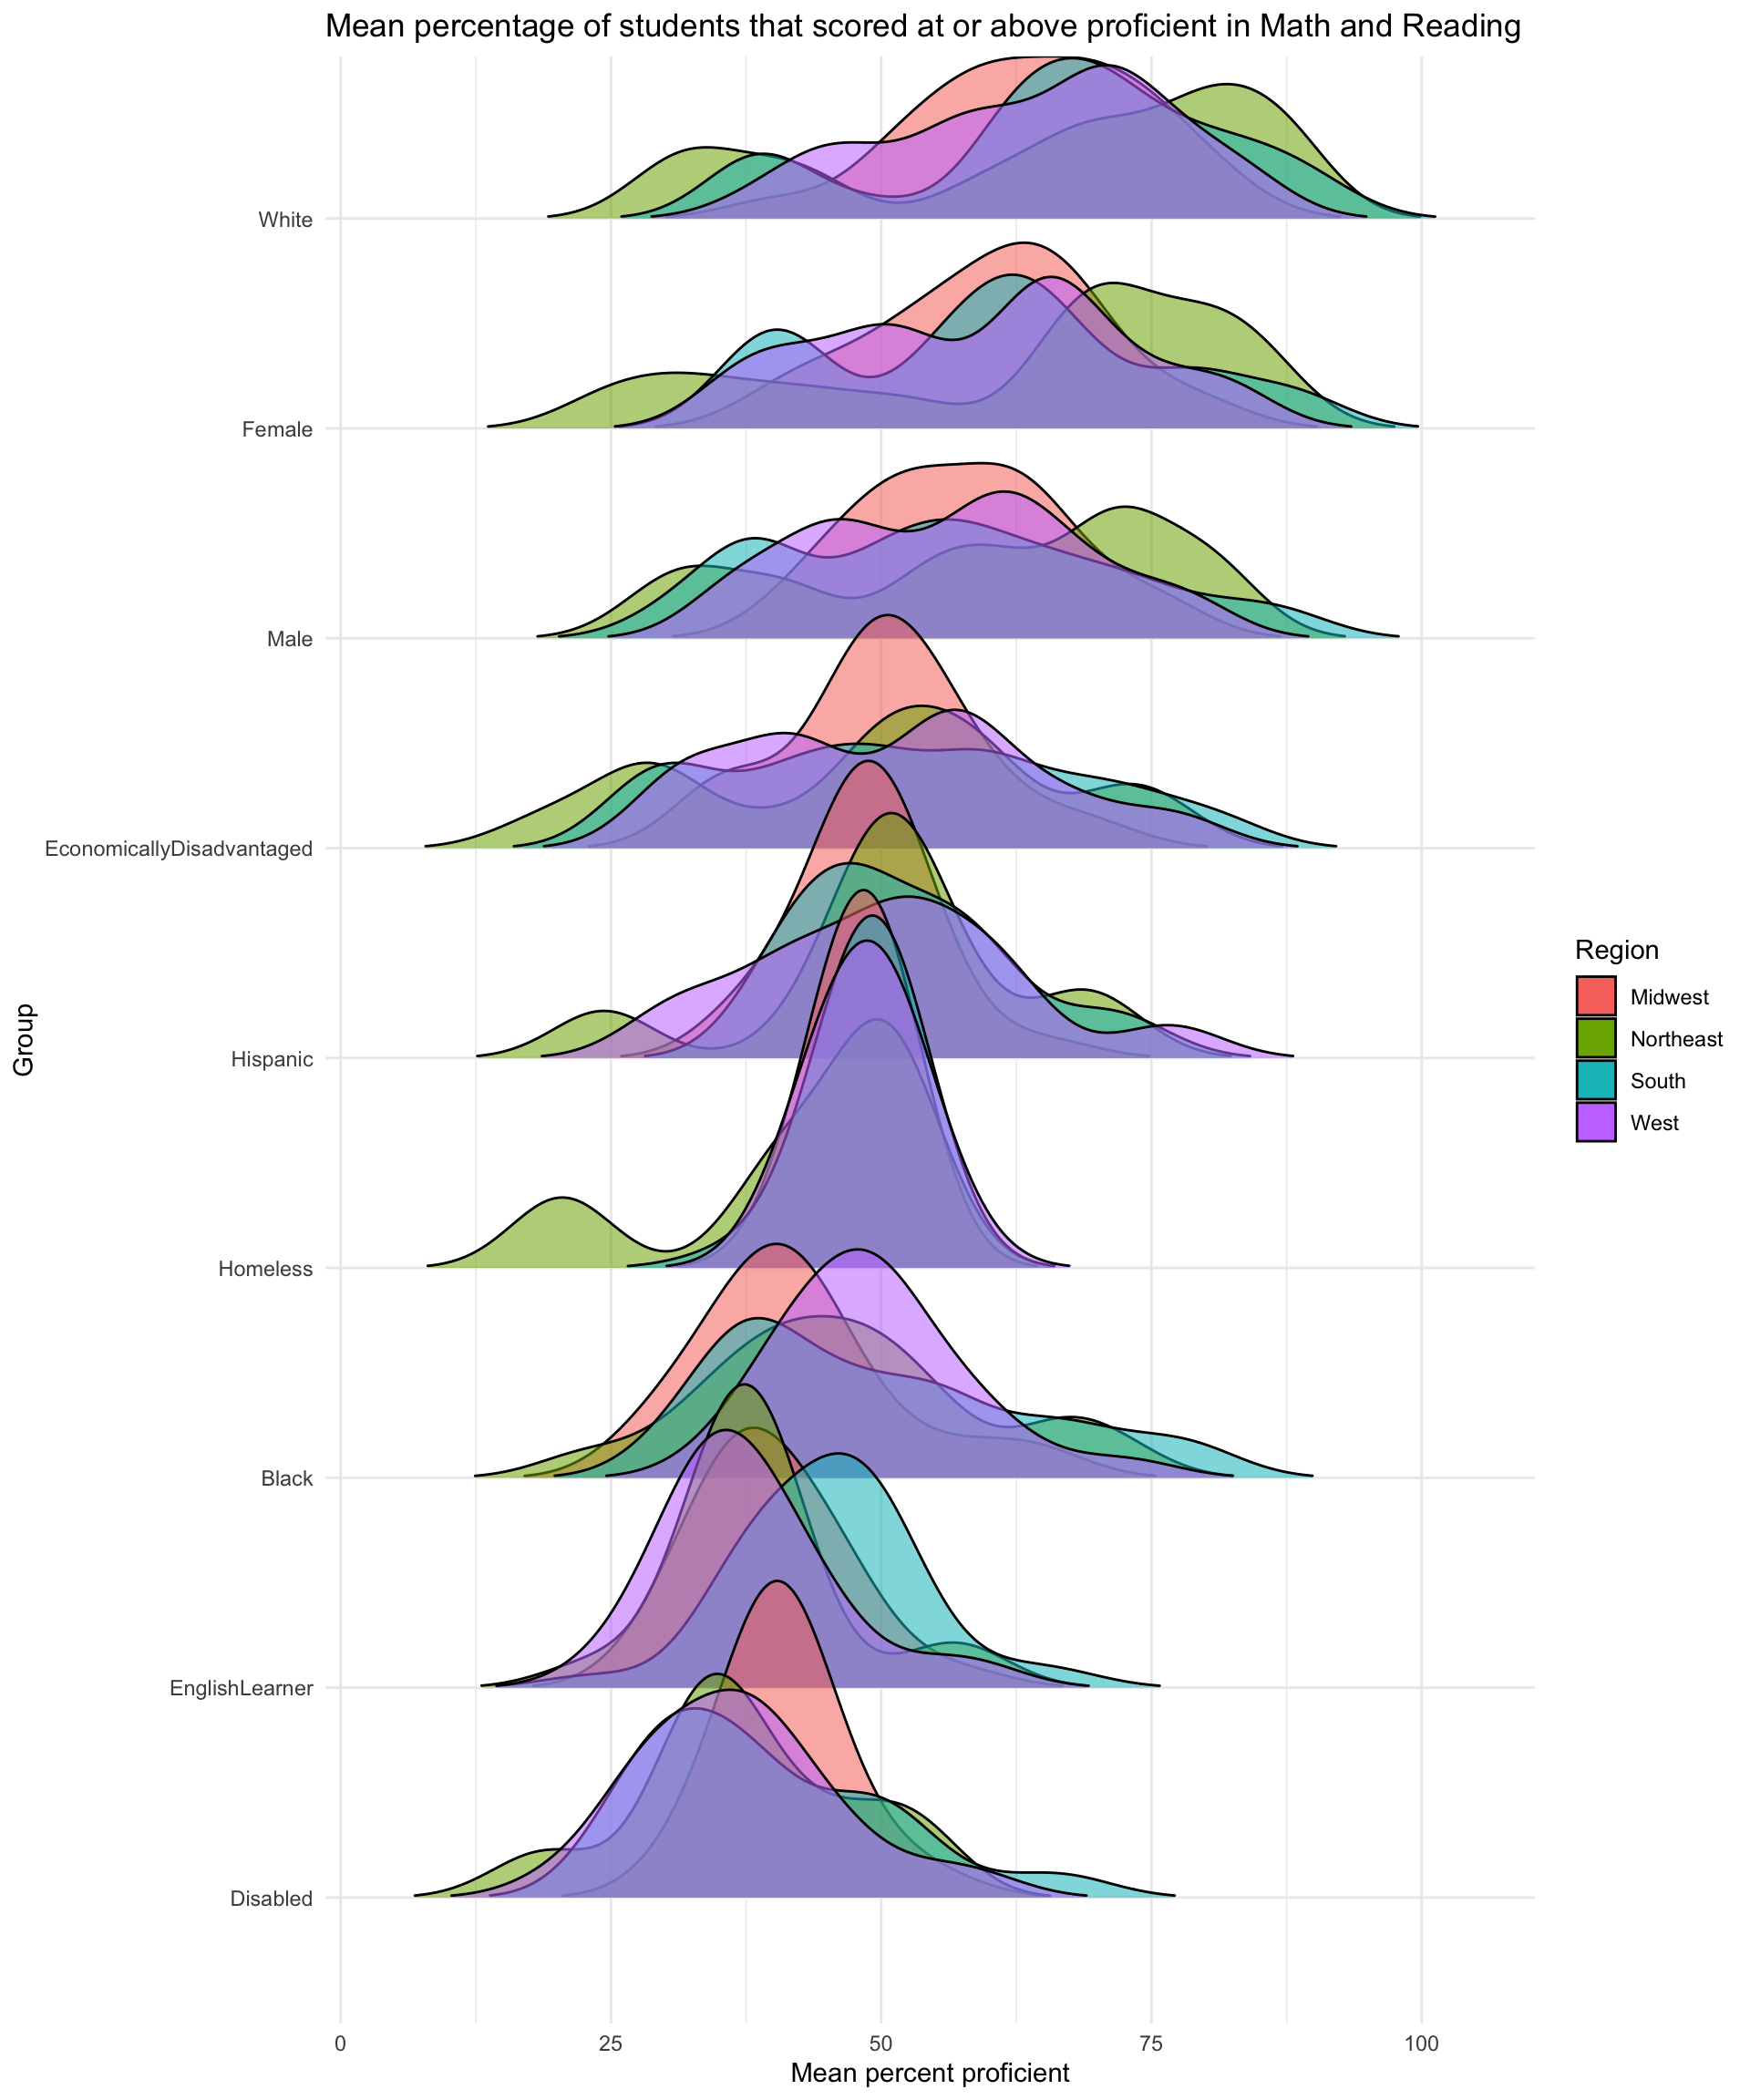
ggridges: mean test score by subgroup and test by region
Mean test score above or at proficient grouped by regions in the United States
gt table: mean test scores by state
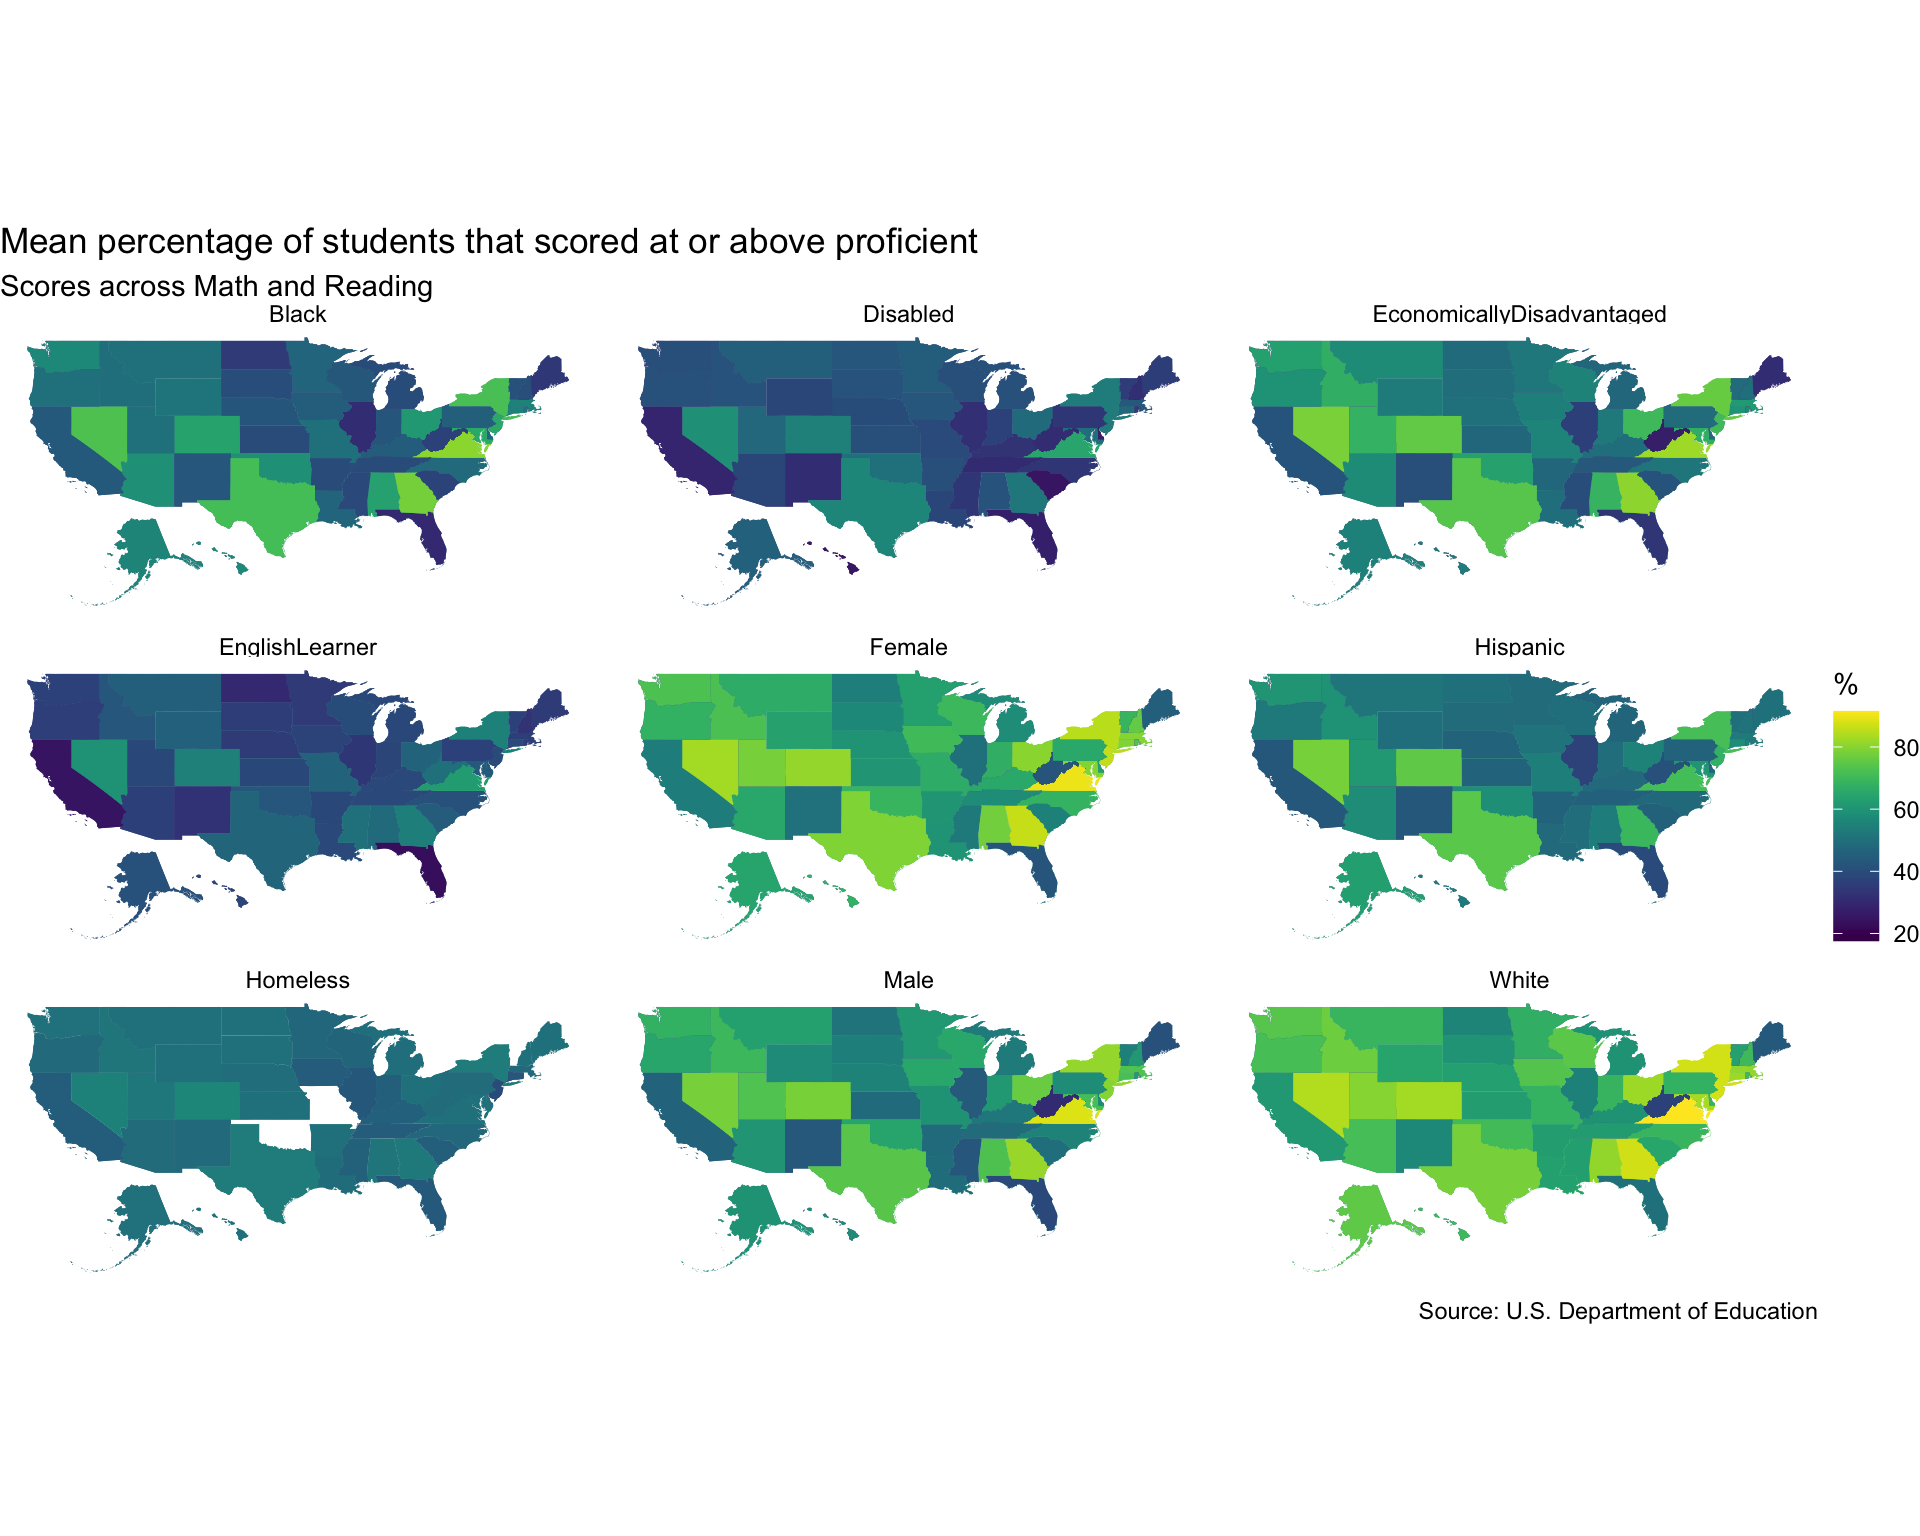
Maps of reading and math scores across the US states
United States maps of student scores above or at proficient in reading and math